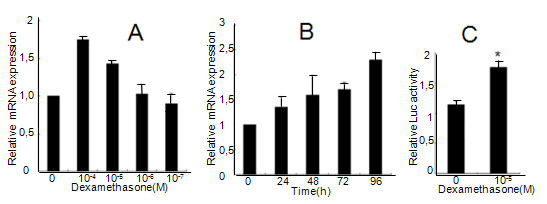
Figure 3.

Effect of dexamethasone on PTEN regulation in A549 cells. A representative of three independent experiments is shown. (A): A549 cells were treated with dexamethasone at the indicated concentrations for 24 h. (B): A549 cells were treated with dexamethasone (10-5 M) for 24 h, 48 h, 72 h and 96 h. The PTEN mRNA level was measured by quantitative real-time PCR. (C): A549 cells were transfected with the PTEN promoter luciferase plasmid for 24 h and treated with 10-5 M dexamethasone for another 24 h. The luciferase levels were obtained from three experiments performed in duplicate. *p < 0.05 vs control group (p = 0.0003).
