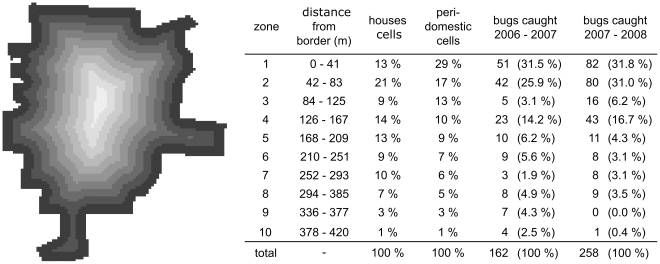
Figure 1. Grid of the village of Teya, Yucatan (Mexico) and the control zones.
The grid was derived from the satellite image and the GPS coordinates of all houses. Each cell of the grid corresponds to a surface of 13.5×13.5 m. The ten concentric zones that were used to test the efficacy of spatially targeted control appear on the map. The table gives the proportion of houses, the proportion of peri-domiciles and the number of bugs found (in the absence of control) between mid-September 2006 and 2007, and between mid-September 2007 and 2008, in each of these zones.

