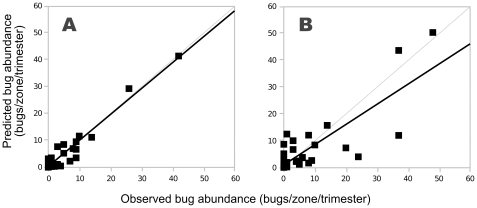
Figure 2. Correlation between observed and predicted bug abundance in the houses.
(A) Descriptive value of the model: correlation between predicted values and abundance data during the first year of field collections that were used to estimate the model parameters. Predicted abundance = 0.97+0.36 x Observed abundance year 1 (McFadden's likelihood ratio index = .93). (B) Predictive value of the model: correlation between predicted values and the abundance data during the second year of field collections. Predicted abundance = 0.75+1.07 x Observed abundance year 2 (McFadden's likelihood ratio index = 0.67). The grey lines indicate a perfect relationship.

