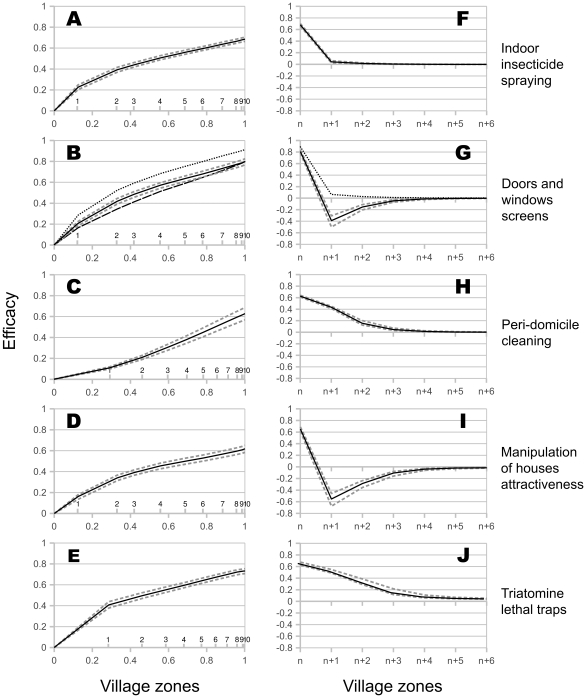
Figure 3. Global and local efficacy of the five control strategies.
(A–E) Global efficacy. Relationships between the post-intervention reduction in bug abundance in the whole village, and the control effort, measured as the extent of village zones treated, expressed in proportion of the number of houses in the whole village (below the axis) and in number of village zones (above the axis). (F–J) Local efficacy. Reduction of bugs abundance in untreated village areas (>n) when the control intervention is limited to the n outer village zone(s). In A–J, grey dashed lines give the minimal and maximal efficacies obtained when demographic parameter values were varied within the 95% confidence interval of their MLE. In B and G, dashed, solid and dotted black lines correspond to the variation of efficacy according to the different assumptions made on bug behaviour after they fail to enter a given house because of screens. Dotted line: assumption 1, to stop dispersing and die. Solid line: assumption 2, to stop dispersing for one day before starting again with no learning in their dispersal behaviour (and thus possibly attempting to enter the house they just failed to infest). Dashed line: assumption 3, to go on dispersing while avoiding the house they could not enter. In G the dashed line is confounded with the solid one.

