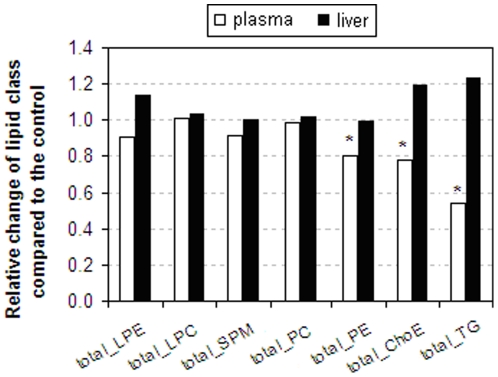
Figure 5. Rimonabant significantly decreases the overall responses of plasma lipid classes.
Relative change of the summation of the individually measured lipids in different lipid classes was determined based on plasma and liver lipidomics data of the rimonabant group and the controls (white bars: plasma samples; black bars: liver samples). The summation of the individually measured lipids in each lipid class in the control is set to be 1, * p<0.05 vs. the control.

