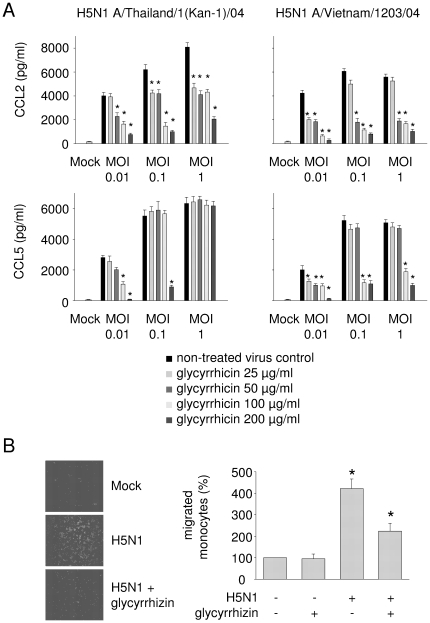
Figure 3. Influence of glycyrrhizin on H5N1-induced expression of CCL2 and CCL5 in A549 cells and on monocyte migration towards supernatants of H5N1-infected A549 cells.
A) Excretion of cytokines by non-infected (Mock) A549 cells or A549 cells infected with different H5N1 strains at different MOIs 24 h post infection determined by ELISA. For each MOI five bars are presented. From the left to the right these bars represent: untreated virus control, glycyrrhizin 25 µg/ml, glycyrrhizin 50 µg/ml, glycyrrhizin 100 µg/ml, glycyrrhizin 200 µg/ml. * P<0.05 relative to non-treated virus control. B) Representative pictures of monocytes migrated towards supernatants of H5N1-infected A549 cells and quantification of migrated monocytes towards supernatants of H5N1-infected A549 cells relative to supernatants of non-treated Mock cells. Primary human monocytes (106 cells) were seeded on 8 µm filters. The filters were placed into wells containing supernatants of non-infected (Mock) or H5N1 A/Thailand/1(Kan-1)/04 (MOI 0.1)-infected glycyrrhizin (100 µg/ml)-treated or non-treated A549 cells. After 24 h, the migrated monocytes were quantified after fixation and DAPI staining of the cells attached to the lower surface of the membranes. Five random fields (each 0.25 mm2) were counted at 200× magnification. * P<0.05 relative to supernatants of non-treated Mock cells.

