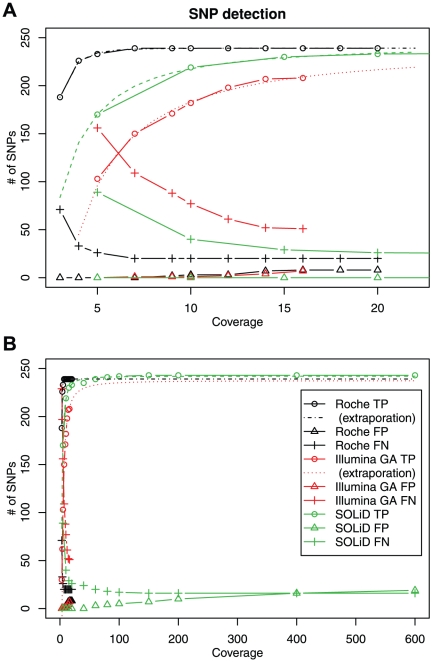
Figure 2. Numbers of true and false detection as a function of the mean coverage.
(A) Magnification of the low coverage range. (B) Whole range. The circle, triangle and cross symbols indicate the number of True Positive (TP), False Negative (FN) and False Positive (FP), respectively. Black, red and green represent FLX, GA and SOLiD, respectively. The extrapolated lines for the saturation of TP using FLX and GA were added in (B).

