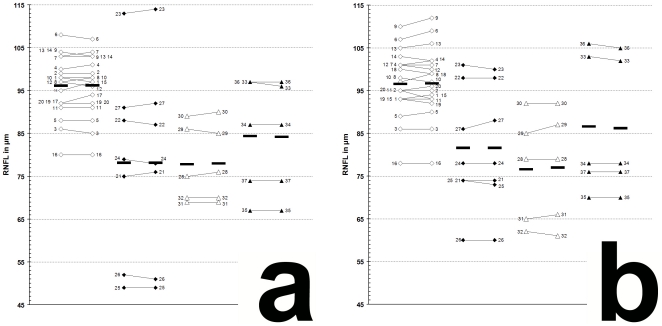
Figure 1. Global RNFL changes between baseline and follow-up examination.
a, left eye; b, right eye; 1–37, patient 1–37 (see table 1 for demographic and clinical data); white squares, RRMS without ON (baseline|—|follow-up); black squares, RRMS with ON (baseline|—|follow-up); white triangles, SPMS without ON (baseline|—|follow-up); black triangles, SPMS with ON (baseline|—|follow-up); black bars, means.

