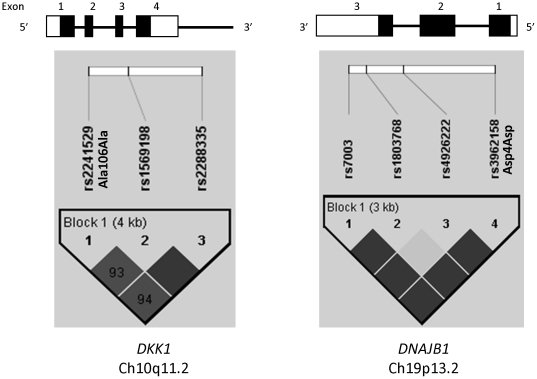
Figure 1. Gene structure and linkage disequilibrium plot for DKK1 and DNAJB1.
The gene structure is shown at top, with exons shown as filled boxes, untranslated regions as unfilled boxes and introns as connecting lines. The locations of the genotyped SNPs relative to the exons are indicated. The linkage disequilibrium (LD) plot at the bottom displays D' values (%) for each pair of SNPs in the box at the intersection of the diagonals from each SNP. The solid blocks indicate D' = 1 for the corresponding pair of variants. The darker solid blocks indicate a logarithm of the odds (LOD) score ≥2 for the corresponding pair of variants; lighter solid blocks indicate a LOD score <2. Within each gene, SNPs were considered together in one haplotype block as indicated.

