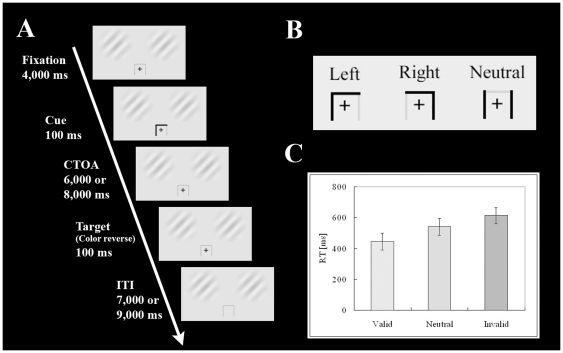
Figure 1. A summary of the experimental procedure.
(A) Schematic representation of a procedure of the task. First, a cross was projected at the center of the visual field (duration 5,000 ms), followed by an arrow-shaped cue to indicate the direction to be paid attention (duration 100 ms). In this case, the participants had to pay attention to the left Gabor patch. After CTOA of 6,000 or 8,000 ms, a target appeared at either left or right position away from the center (duration 100 ms). The participants had to press a button if they successfully detected it. (B) Two types of cue; a “spatial cue” to the left or right, and a “neutral cue”. (C) Mean RT in each attentional condition (valid, neutral, and invalid). Error bars show SEM.

