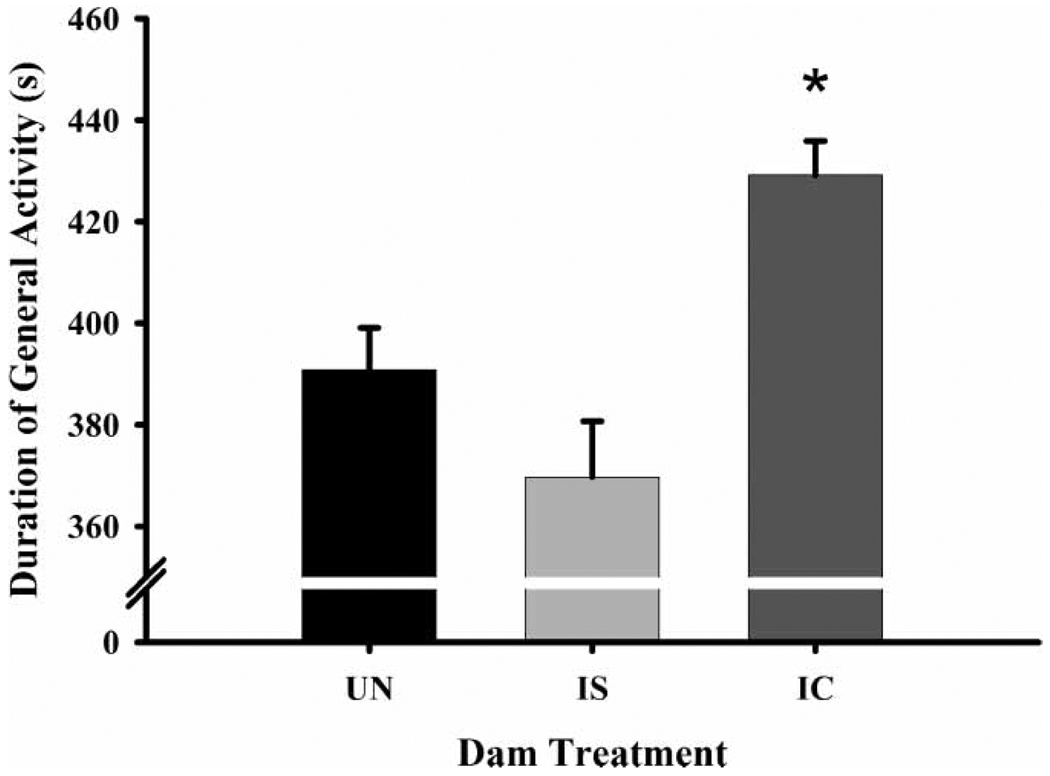
Figure 4.
The duration of general activity by dam treatment groups on PPD eight. Each bar represents least squares mean (LSM) and standard error (±SEM) for n = 80 untreated (UN), 76 intermittent saline (IS), and 70 intermittent cocaine-treated (IC) dams. As indicated by the asterisk, results indicate a significantly higher general activity level in the IC-treated dams compared to both the UN (p ≤ 0.01) and IS (p ≤ 0.01) groups.

