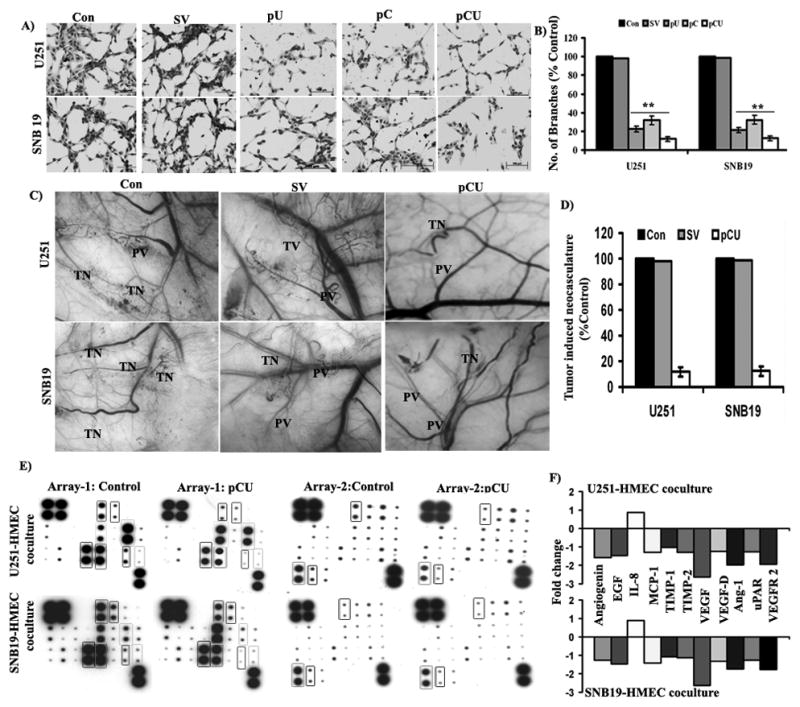
Figure 2. Effect of uPAR and cathepsin B knockdown on tumor-induced angiogenesis and expression of angiogenic molecules.

(A) In vitro angiogenesis in U251 and SNB cells. Tumor-induced tube formation in HMEC cells was carried out as described in Materials and Methods. The tube formation was observed under the bright field microscope and number of branch points was calculated. (B) Graphical representation of relative branch points in U251 and SNB19 cells transfected with SV, pU, pC and pCU. Bars represents the means ± SE of three different experiments. The asterisk (*) represents statistically different compared to control (**p<0.001). (C) Inhibition of tumor-induced angiogenesis in U251 and SNB19 cells transfected with pU, pC and pCU as assessed by dorsal skin-fold chamber assay. Tiny, zigzag-shaped microvessels showing irregular arrangement were recorded as tumor-induced neovasculature (TN) and more organized vessels were designated as pre-existing vasculature (PV). (D) In vivo angiogenesis was quantified by measuring the length of TN in control and transfected cells and expressed as a percentage of control. Values were mean ± SD from five animals per treatment group. (E) Expression of pro and anti-angiogenic molecules in HMEC and U251 or SNB19 co-cultures. Conditioned media from HMEC and U251 or SNB19 co-cultures, exposed to angiogenesis antibody arrays and processed as per manufacturer’s instructions. (F) Graphical representation of fold change of angiogenin, EGF, IL-8, MCP-1, TIMP-1, TIMP-2, VEGF, VEGF-D, angiopoietin-1, uPAR and VEGFR-2 expression in HMEC and U251 or SNB19 co-cultures.
