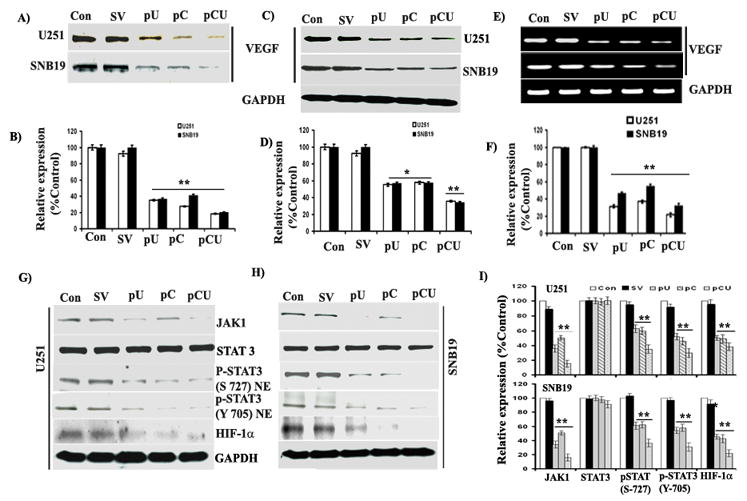
Figure 3. Downregulation of uPAR and cathepsin B using siRNA inhibits VEGF expression.

U251 and SNB19 cells were transfected with SV, pU, pC and pCU for 48 hrs. Conditioned media was collected after overnight incubation with serum-free medium. (A) Immunoblot analysis of VEGF expression in conditioned media from control and transfected U251 and SNB19 cells (B) Quantification of VEGF expression in conditioned media by densitometry. (C) Western blot analysis of VEGF expression in U251 and SNB19 cell lysates, which were prepared 48 hrs after transfection. The blots were stripped and re-probed with GAPDH antibody to verify equal loading. The experiments were performed three times and representative blots are shown. (D) Densitometric analysis of VEGF expression in cell lysates from U251 and SNB19 cells. Columns: mean of triplicate experiments; bars: SE; *p<0.05 and **p<0.001. (E) Semi-quantitative RT-PCR analysis of VEGF mRNA transcription in U251 and SNB19 cells. Total RNA was extracted and PCR was set up as described in Materials and Methods for VEGF. (F) Densitometric analysis of VEGF mRNA expression. (G–H) Western blot analysis of JAK1, p-STAT3 (S-727 and Y-705), and HIF-1α expression in U251 and SNB19 cell lysates. Cell lysates were collected from SNB19 and U251 after transfection with SV, pU, pC or pCU. (I) Quantification of protein band intensities by densitometric analysis using NIH ImageJ software. Columns: mean of experiments performed in triplicate; bars: SE; *p<005 and **p<0.001, significant difference from untreated control or SV transfected control.
