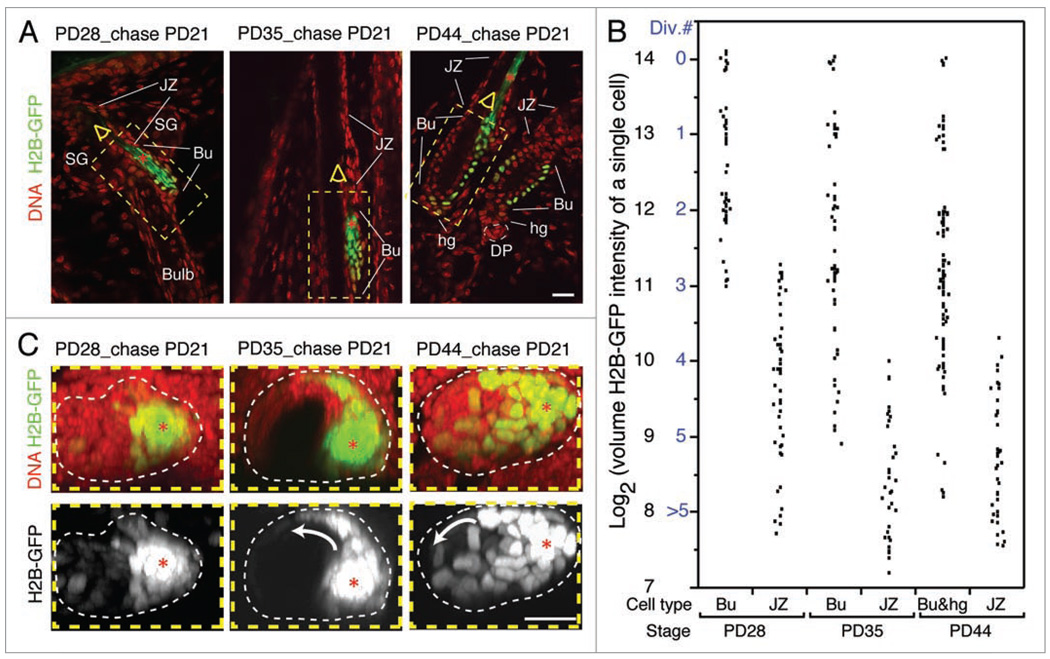
Figure 4.
Proliferation at the junctional zone and lateral movement of bulge cells in catagen. (A) A single optical confocal slice from image stacks illustrates H2B-GFP retention in the bulge (Bu) as compared to the junctional zone (JZ) after each experiment. (B) Quantification of volume H2B-GFP intensity by integration through the optical stack for individual cells located in different hair follicle compartments defined by morphology. Cell divisions numbers were assigned to cells based on 2-fold dilution of H2B-GFP intensity per division, and the estimate that the brightest cells did not divide (reviewed in ref. 17). (C) Top view sum projection of the bulge region stacks highlighted in (A) with yellow dotted box revealing active re-localization of bright H2B-GFP cells from the old club hair shaft (red asterisks) to the new bulge region (indicated by white arrow). hg, hair germ; SG, sebaceous gland; DP, dermal papilla. All skin sections were 100 µm thick and stained with TOPRO3 DNA dye. Scale bars, 20 µm. N = 10 hair follicles per stage.

