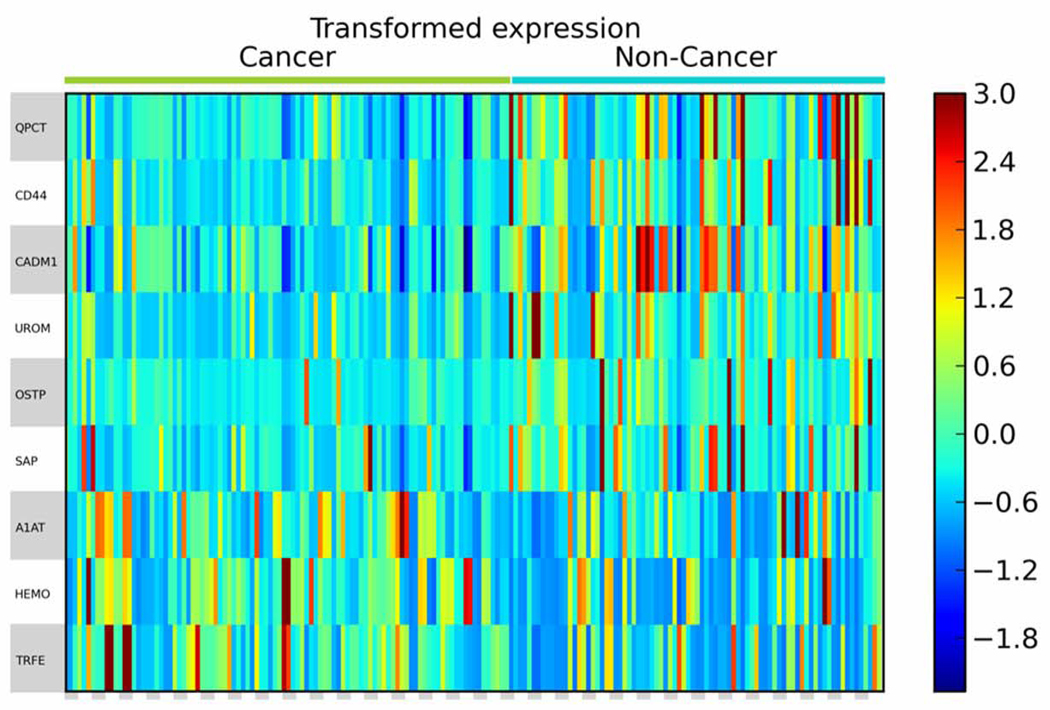
Figure 3.
Heat map of differentially expressed urinary glycoproteins identified in duplicate analyses of 103 samples. The heat map displays the transformed spectral counts data. Each column represents an independent analysis for each sample. Each row represents a specific glycoprotein identified by LC-MS/MS.

