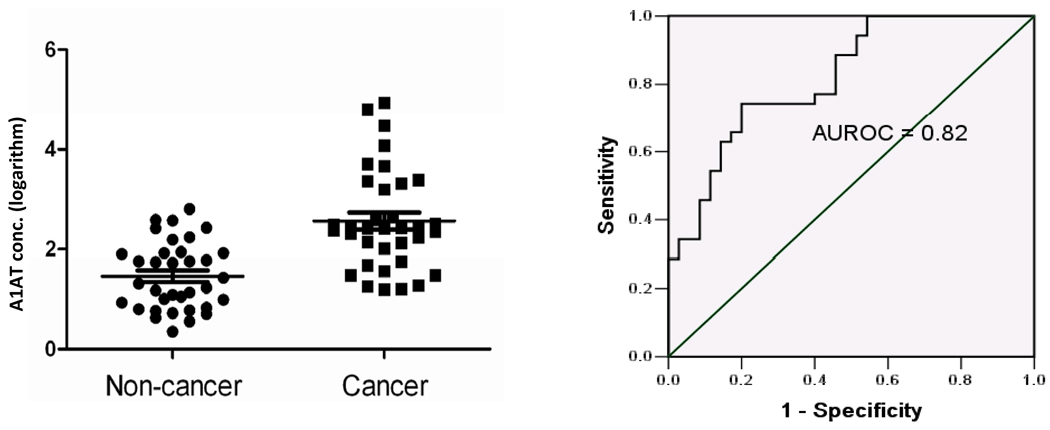
Figure 4.
ELISA analysis of urinary A1AT. Left panel shows a scatter-plot of creatinine-normalized urinary A1AT concentration (logarithm M) in study subjects with (Cancer), and without (Control) bladder cancer. Differential levels were significant (p < 0.0001). Error bars denote standard deviation. Right panel shows ROC curve of A1AT data; area under the ROC (AUROC) of 0.82.

