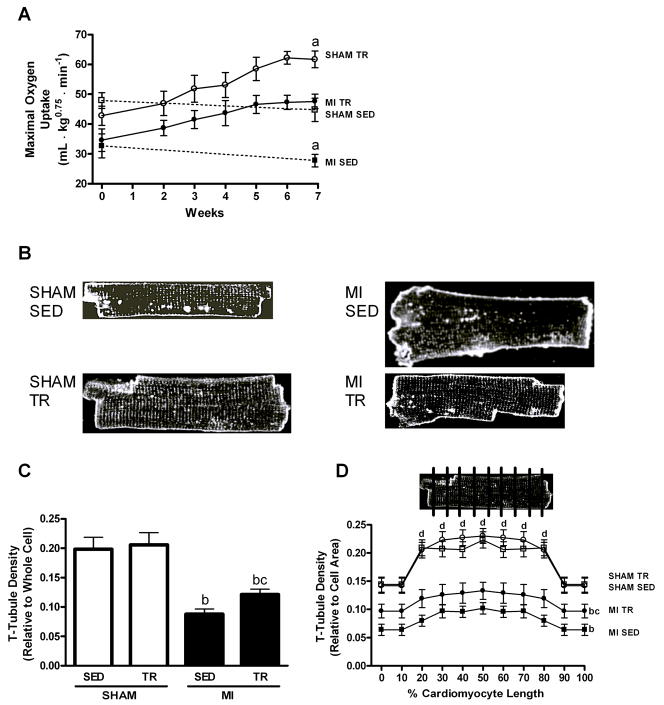
Figure 1.
Maximal oxygen uptake (VO2max; A), representative examples of cardiomyocytes stained by Di-8-ANEPPS for imaging transverse (T)-tubules (B), and relative T-tubule density in whole cardiomyocytes (C) and in sections along the longitudinal cells (D; inlet illustrates the cardiomyocyte sectioning) from sedentary (SED) and exercise trained (TR) sham-operated (SHAM) and post-myocardial infarction (MI) rats. Note that SHAM TR cardiomyocytes showed sustained T-tubules despite the physiologic hypertrophy; that post-MI cardiomyocytes showed reduced T-tubules amid pathologic hypertrophy, and that TR in post-MI rats partly restored T-tubules and reversed the pathologic remodeling. a: difference from other groups, p<0.01; b: difference between MI groups and SHAM groups, p<0.01; c: difference between MI TR and MI SED, p<0.05; d: difference from middle section (20–80%) of SHAM cardiomyocytes to the end sections (0–10% and 90–100%), p<0.05 (not in MI cardiomyocytes). Data are mean±SEM with 8 animals/group.

