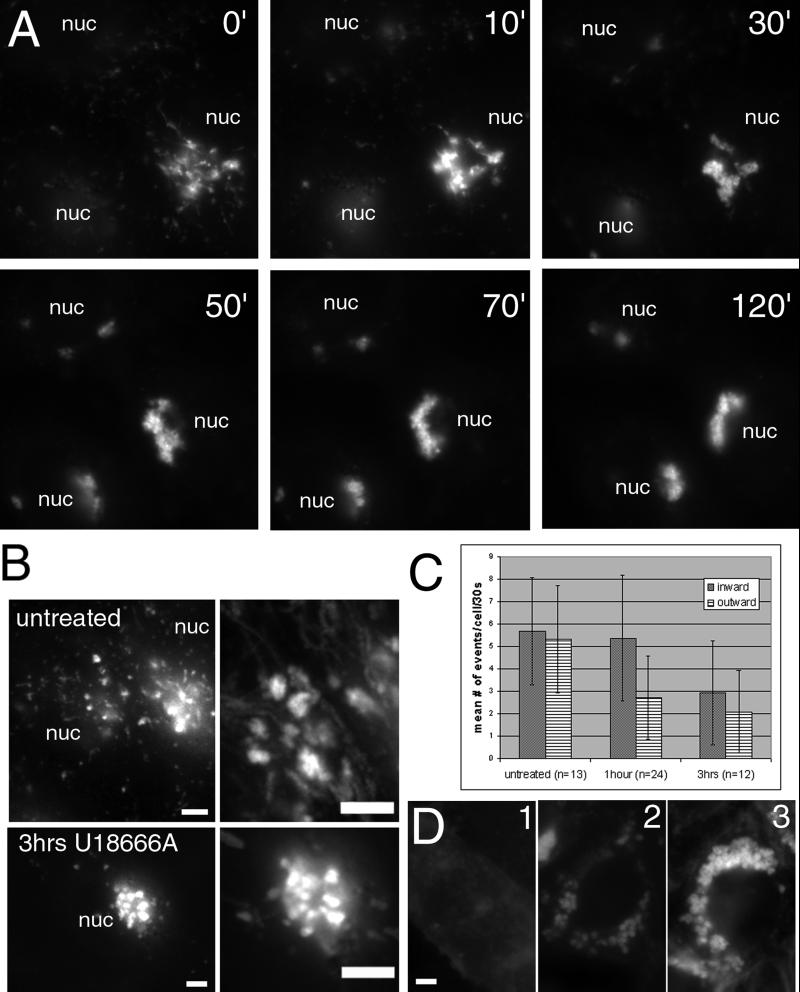
Figure 7.
The formation of cholesterol-laden organelles in cells treated with U18666A. Cells were incubated with 10 μM U18666A and imaged every 30 s for the first 2 h of treatment (A). By 2 h, all cells displayed a prominent perinuclear aggregate formed from the loosely associated, dynamic perinuclear cluster of NPC1 organelles present in untreated cells. (B) Images (100) taken over 25 s have been merged to show the tracks of movement into and out of this perinuclear cluster in untreated cells and cells treated for 3 h with U18666A. Quantification of the movement to and from the perinuclear aggregate (C) reveals decreased movement out of the aggregate at 1–1.5 h and decreased movement in both directions by 2.5–3.5 h. The effects of U18666A did not require the presence of exogenous sources of cholesterol as shown by filipin staining in D. Cells incubated in F12 without serum for 48 h (D1) still formed enlarged cholesterol-laden organelles when incubated for the final 24 h with U18666A (D2), though the overall amount of cholesterol was not as high as that seen in cells grown in F12 (+10% fetal bovine serum) for 24 h with U18666A (D3). nuc, nucleus; bar, 5 μm. Video 7 accompanies Figure 7B untreated. Movements of perinuclear NPC1-FP organelles in untreated cells. Images were acquired approximately every 0.25 s for 50 s and played back at a rate of 15 images per second. Video 8 accompanies Figure 7B 3 h U18666A. Decreased movements of perinuclear NPC1-FP organelles in cells following U18666A treatment. Images were acquired approximately every 0.25 s for 25 s and played back at a rate of 15 images per second. Video 6 accompanies Figure 7A. The formation of abnormal organelles in cells treated with U18666A. Images were acquired every 30 s for 2 h and played back at a rate of six images per second.

