Figure 2.
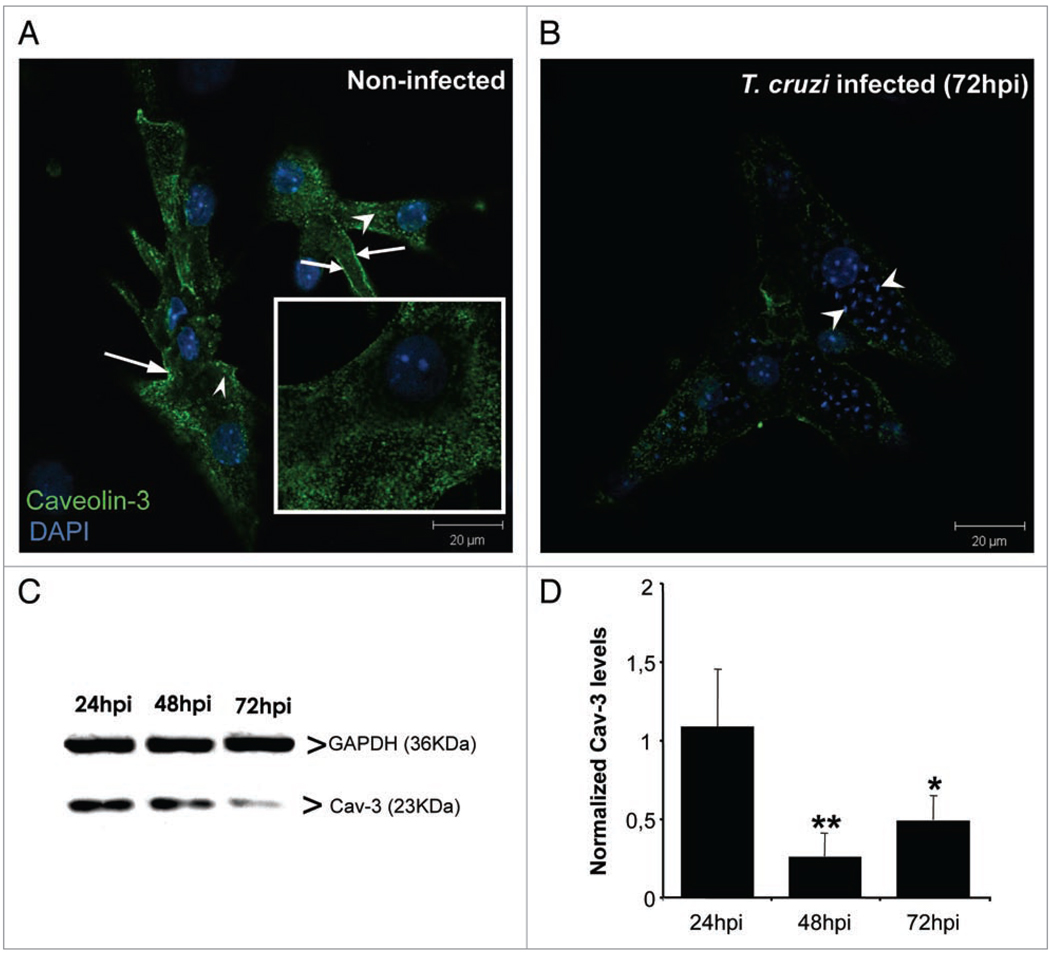
Caveolin-3 (Cav-3) expression is decreased after T. cruzi infection. Cultured cardiac myocytes were infected for 3 days. (A) Representative confocal Laser Scanning analysis of Cav-3 distribution in uninfected cardiac myocytes fixed and stained after 96 hours in culture. Cells presented abundant caveosomes (arrowheads) and peripheral staining (white arrows). The inset depicts higher magnification of the Cav-3 staining. (B) After 72 hours of infection, Cav-3 signal was reduced among highly parasitized cardiac myocytes, present mostly at cell periphery and with reduced presence of caveosomes. (C) Representative immunoblot of Cav-3 (23 KDa) expression in infected and uninfected cardiac myocytes. Anti-GAPDH (36 KDa) antibody was used as a loading control. (D) Bar graph demonstrating quantification of Cav-3 expression as normalized by GAPDH. There was a significant decrease of Cav-3 expression 48 (74%) and 72 (51%) hours post infection (n = 4) **p < 0.01; *p < 0.05, ANOVA. Bars = 20 µm.

