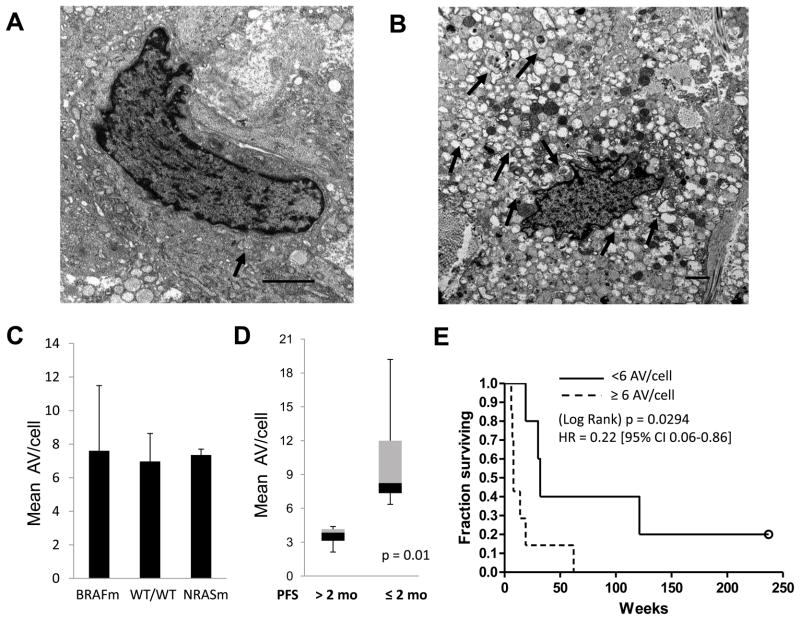
Figure 1. Tumor cell autophagy and clinical outcome in patients with metastatic melanoma.
Tumor biopsies of cutaneous metastases from Stage IV melanoma patients (n=12) treated on a phase II trial of temozolomide and sorafenib were processed for electron microscopy (EM).(A–B) Representative images of a tumor with low (A) or high (B) number of autophagic vesicles per cell (AV/cell; arrows), scale bar 2 μm . (C) Mean ± standard error of mean (SEM) of the average number of AV/cell by EM in tumors that had the following genotypes: BRAFm: BRAF V600E/NRAS wild type (WT); WT/WT: BRAF WT/NRAS WT or BRAF WT/NRAS failed NRASm: BRAF WT/NRAS Q61K (D) Box and whisker plots of mean AV/cell with ≤2 months or >2 months progression-free survival (PFS); P=0.001, Mann-Whitney test (D) Kaplan-Meier survival analysis for patients with tumors containing <6 AV/cell (solid) and ≥6 AV/cell (dashed); HR 0.22 [95%CI 0.06–0.86] p=0.03 log rank test.

