FIG. 1.
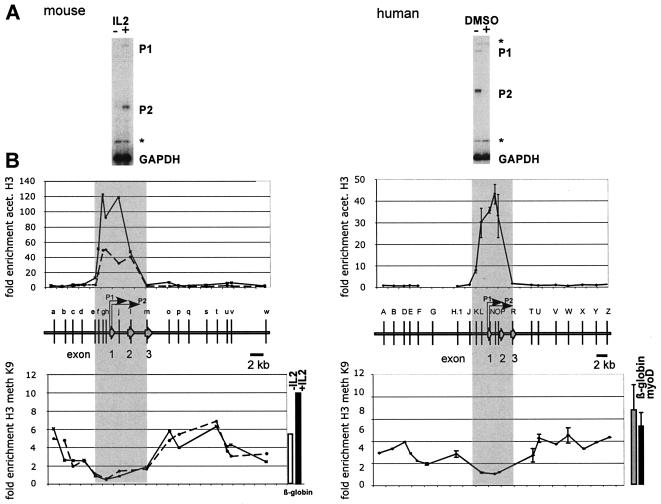
The conserved pattern of histone acetylation (acet.) and methylation (meth) defines the boundaries of the mammalian c-myc locus. (A) Expression of the c-myc gene in resting (−IL-2) and mitogen-induced (+IL-2) mouse T cells (CTLL2) and in proliferating (−DMSO) and differentiating (+DMSO) human promyelocytic leukemia cells (HL60). C-myc transcripts initiated at the P1 and P2 promoters are undetectable both in resting CTLL2 cells and in differentiating HL60 cells. Total RNA was analyzed in a S1 nuclease assay with end-labeled probes specific for the mouse or the human c-myc gene. End-labeled oligonucleotides specific for the mouse and human GAPDH gene were included as controls. Asterisks denote undigested probe. (B) ChIP experiments were performed with anti-acetylated H3 and anti-methylated K9 H3 antibody. Cross-linked chromatin was isolated from resting (left panel, broken line) and IL-2-induced (left panel, solid line) mouse CTLL2 cells, and from proliferating human HL60 cells (right panels). DNA isolated from immunoprecipitated chromatin was subjected to duplex PCR to amplify DNA fragments from the mouse (left panels) or human c-myc locus (right panels). The relative positions of the amplified regions (a through w and A through Z, respectively) are indicated by vertical bars. To determine the relative levels of H3 acetylation in these regions, primers specific for the mouse β-globin gene promoter (upper left panel) or for region G (upper right panel) were included in the PCRs as internal standards. Enrichment of K9-methylated H3 was measured relative to c-myc exon 1 (human) or c-myc exon 2 (mouse) sequences. The degree of enrichment is calculated relative to the ratio of the signals obtained in the input DNA fraction using the c-myc and β-globin primer pairs. Results from the human c-myc gene are based on two independent experiments using different chromatin preparations. Data shown for the mouse c-myc gene are results from a single representative ChIP experiment. High levels of H3 acetylation are detected across promoter and transcribed regions in both species, from −2.5 kb to +4.5 kb relative to exon 1 (shaded area). The hyperacetylated regions are flanked by heterochromatin enriched in K9-methylated histones H3. The degree of hypermethylation is similar to that of the transcriptionally inactive murine β-globin gene in CTLL2 cells (see bars to the right of the lower panel) and of the human myoD and β-globin genes in HL60 cells.

