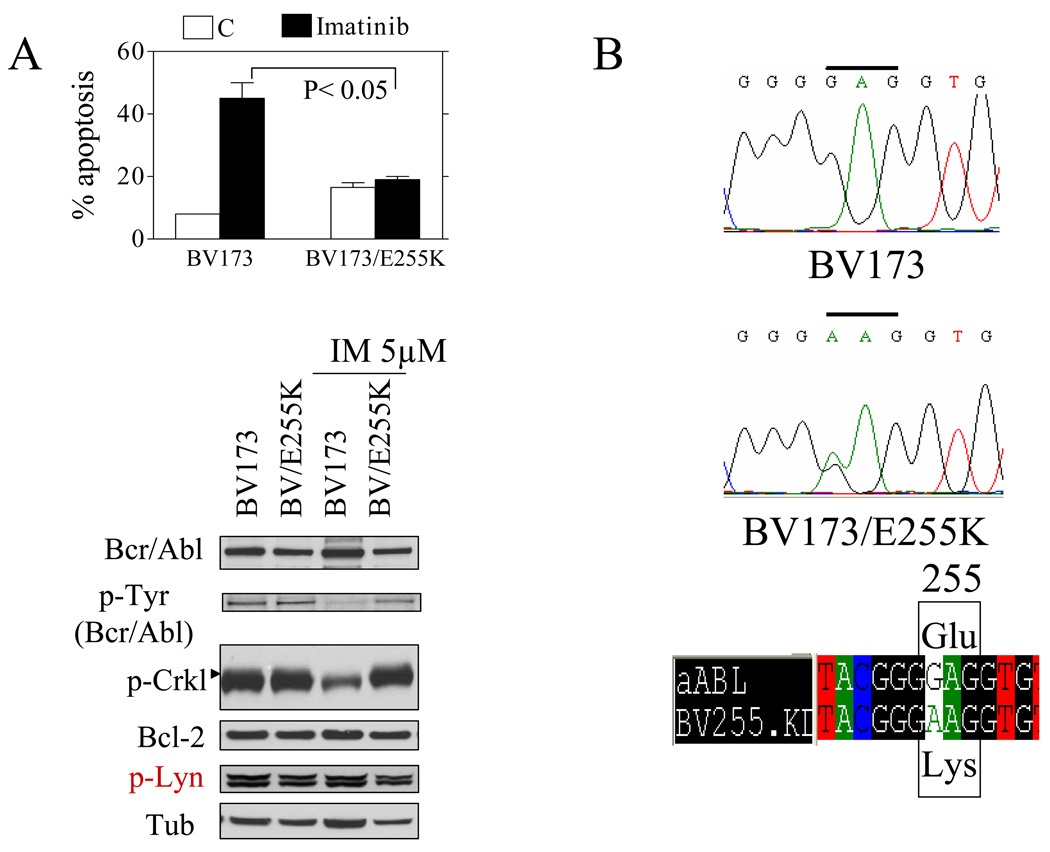
Figure 2. Characterization of Ph+ALL imatinib-resistant cells and responses to HDACIs and KW2449.
A) BV173 and BV173/E255K cells were incubated with imatinib (IM) 1 µM for 48 h after which the percentage of apoptotic cells was determined (upper panel, * P<0.05). Alternatively, cells were incubated with IM 5 µM, 4h after which cells were lysed and Western blot performed as described in Methods (WB, lower panel). For this and subsequent studies, lanes were loaded with 25 µg of protein; blots were then stripped and re-probed with antibodies to tubulin to ensure equivalent loading and transfer. Two additional studies yielded equivalent results. B) A single point mutation was detected resulting in an amino acid change (E255K) in BV173/E255K cells. C) A single point mutation was detected at nucleotide 944 changing from a C to T resulting in the T315I mutation in Adult/T315I cells (left panel). K562 and Adult/T315I were cultured in imatinib (IM) 1 µM for 48 hr, after which the percentage of apoptotic cells was determined by 7AAD staining and flow cytometry. D) ALL TOM-1, SUP/B15, BV173, BV173/E255K and Adult/T315I cells were incubated with KW2449 (0.3–0.5 µM) alone or in combination with vorinostat (0.8–1.5 µM) / SNDX275 (0.6–1.2 µM) for 48 hr, after which the percentage of apoptotic cells was determined by 7AAD staining. For all studies, values represent the means ± S.D. for triplicate determinations, * P<0.01. E) Cells were treated with a range of KW2449 and vorinostat at a fixed ratio for 48 hr. At the end of this period, the percentage of apoptotic (7AAD+) cells was determined by flow cytometry, after which combination index (CI) values were determined in relation to fractional effects. CI values less than 1.0 correspond to a synergistic interaction.


