Figure 1.
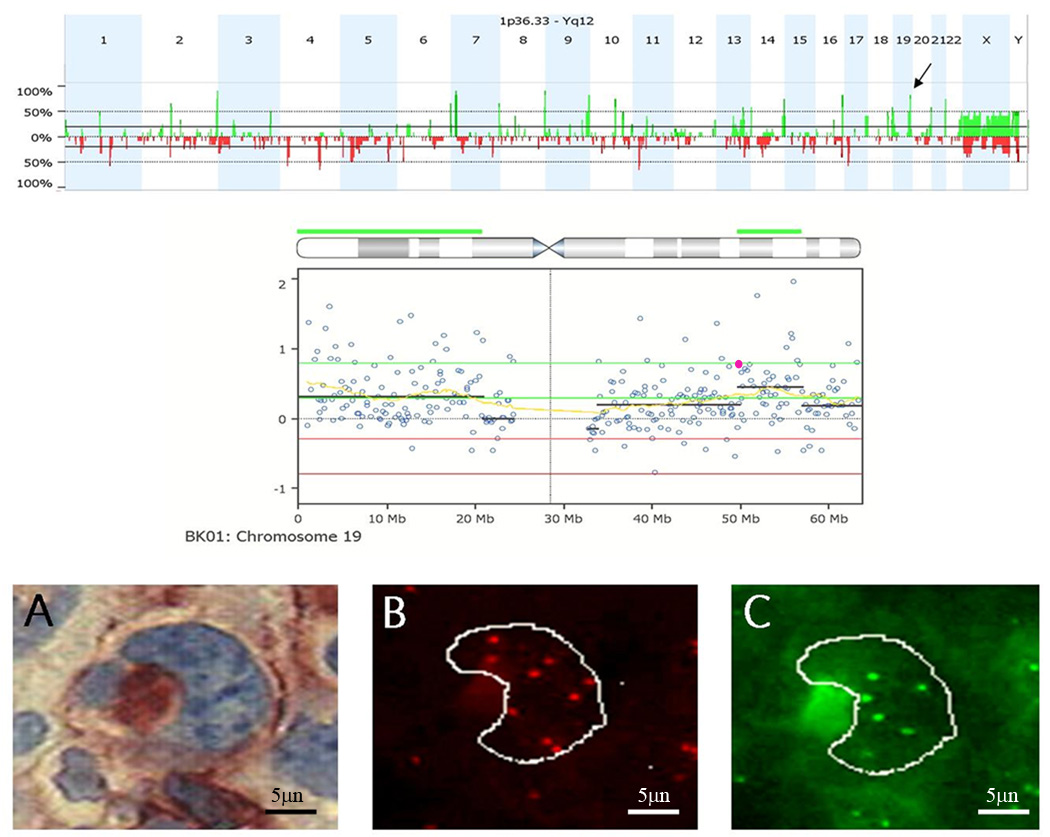
FISH confirmation study to validate CNAs detected by aCGH. Top) Genome aggregate for 12 primary refractory HL samples. Arrow indicates gain of 19q13.31 in 83% of refractory samples. Middle) Chromosome 19 drill down for an Individual sample. Each circle represents an individual BAC on the array. Green line, threshold for gain. Red line, threshold for CNA loss. The yellow line represents the moving average. The black lines represent cluster values of gain or loss defined by a circular binary segmentation algorithm. The highlighted BAC (pink) was selected for FISH validation studies. RP11–876a24 BAC contains the genes for PVR and CEACAM19. Bottom) Representative FISH images for sample BK01. (a) Bright field image of CD30+ cell. (b) The corresponding rhodamine filter image. RP11–876a24 was labeled with digoxigenin and detected with Rhodamine anti-dig. Nine copies of this clone were detected. (c) FITC image of internal control probe, only 6 copies were detected (net gain of three additional copies of PVR in cell).

