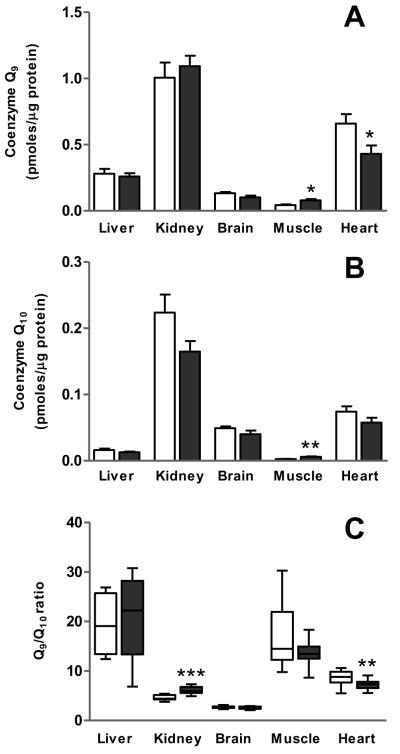
Figure 1.
Tissue distribution of Q homologues and Q9/Q10 ratio. Tissues (liver, kidney, brain, skeletal muscle and heart) were taken from 4 mo old mice that had been fed ad libitum or under 1 mo CR. Quinones were recovered by organic extraction with hexane, and separated and quantified by HPLC. A) Q9 levels. B) Q10 levels. C) Q9/Q10 ratio. Data are means ± SEM (n=16). Significant differences between diets (ad libitum vs CR) are indicated by asterisks (* p<0.05 ; ** p<0.01 ; ***p<0.001). Open bars, ad libitum; Closed bars : CR.

