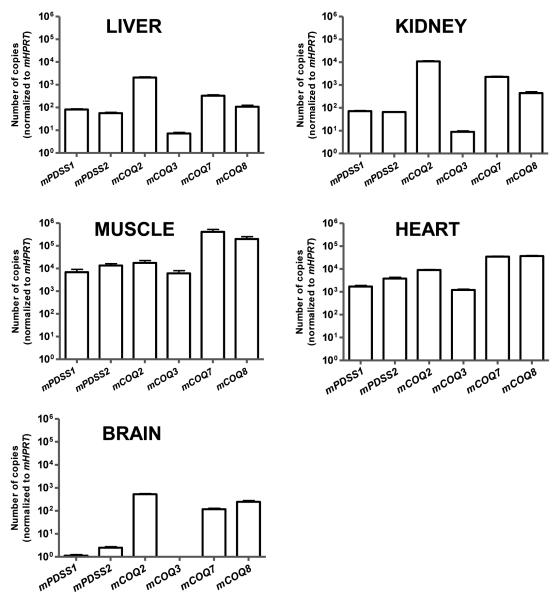
Figure 2.
Patterns of steady-state levels of mCOQ transcripts in mouse tissues. RNA samples were extracted from liver, kidney, brain, skeletal muscle and heart obtained from control animals (fed ad libitum), and then used for reverse transcription and quantification of the absolute number of mRNA copies by qrtRT-PCR. Primers are depicted in Table I. Results obtained for mCOQ mRNAs were normalized to those of mHPRT as internal control. Data are means ± SEM (n=16).

