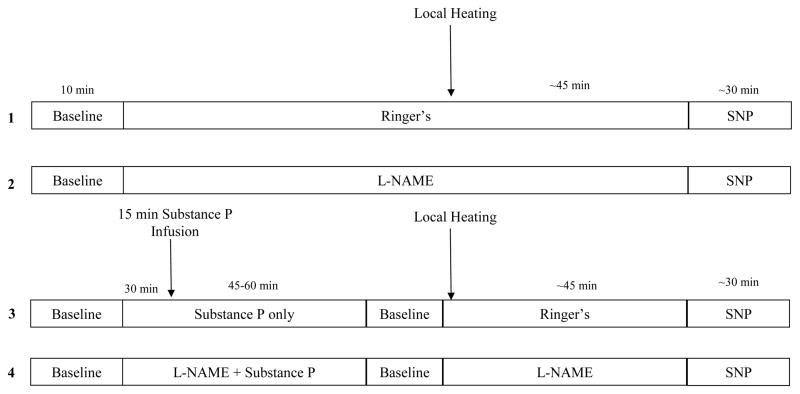
Figure 1. Schematic Drawing of the General Experimental Protocol.
Numbers on left refer to microdialysis sites. Site 1 served as a control. Site 2 served as an L-NAME “control” and was used to determine the independent contribution of NO to cutaneous thermal hyperaemia. Site 3 was used to determine the independent contribution of substance P in cutaneous thermal hyperaemia. Site 4 was used to determine any interaction between substance P and NO in cutaneous thermal hyperaemia.

