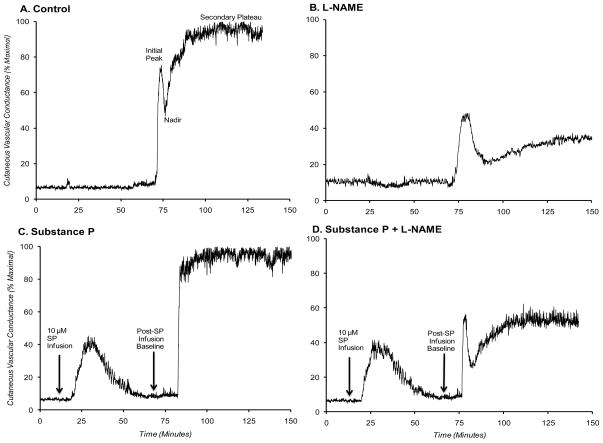
Figure 2. Representative tracing of cutaneous thermal hyperaemic in the four treatment sites.
Data are from one representative subject. A) Control; B) L-NAME; C) pretreatment with substance P; and D) substance P plus L-NAME sites. Depicted are the initial peak, nadir, and secondary (NO-dependent) plateau phases. In panels (C) and (D), initial baseline, substance P-induced vasodilatation, and post-infusion baseline are shown.

