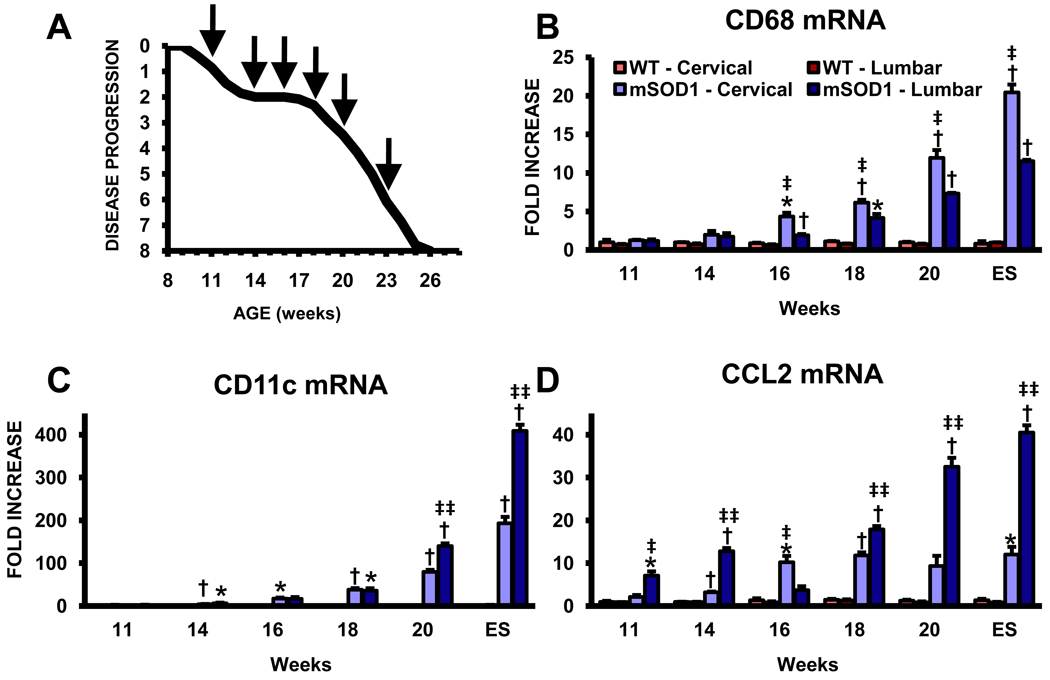
Fig. 2.
Quantitative RT-PCR analyses reveal differentially elevated markers for phagocytic and dendritic cell phenotypes in ALS mice. (A) Graph of the disease progression curve and time points (arrows) when qRT-PCR assays were performed on ALS mice; based upon the BASH score. Each time point represents the mean of n = 3 mice. Notice the stable disease phase from 14 to 18 weeks and the rapidly progressing phase subsequent to 18 weeks. (B) mRNA levels for CD68, a LAMP protein expressed on phagocytic cells CD68. (C) CD11c mRNA levels. Notice the scale of the ordinate in this graph. (D) CCL2 mRNA levels. * ≤ 0.05, ALS mice spinal cord regions compared with the same regions from WT mice; † ≤ 0.01, ALS mice spinal cord regions compared with the same regions from WT mice; ‡ ≤ 0.05, ALS mice cervical spinal cords compared with ALS mice lumbar spinal cords, ‡‡ ≤ 0.01, ALS mice cervical spinal cords compared with ALS mice lumbar spinal cords.

