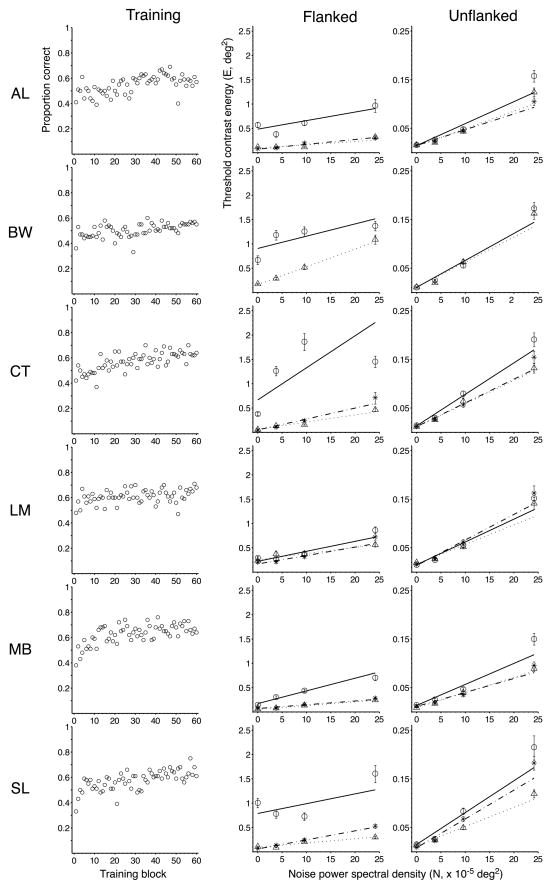
Figure 3.
Training performance (first column) and threshold contrast energy (E) versus noise power spectral density (N) for the flanked (second column) and unflanked (third column) conditions for each subject. Note that the ordinates for E differ by a factor of 10 between the flanked and unflanked conditions. Circles and triangles represent the threshold contrast energy measured during the pre- and post-tests, respectively; asterisks represent the threshold contrast energy during the follow-up test. Solid and dotted lines represent fits of Equation 1 to pre- and post-test data, respectively; dash-dotted lines represent fits to follow-up test data. Error bars are ±SE. Note that subject BW did not participate in the follow-up test.

