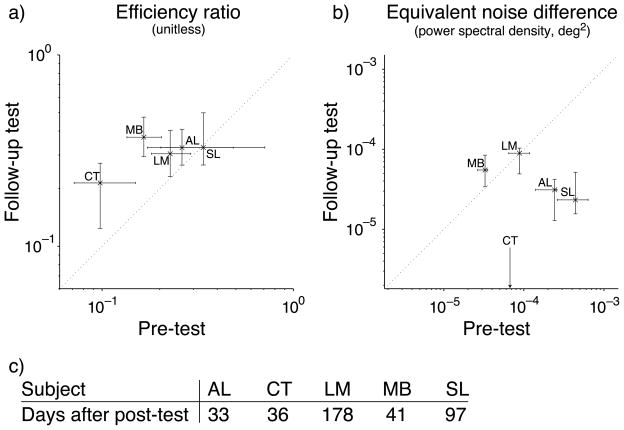
Figure 6.
Retention of learning. (a) Median efficiency ratio (ηr) in the follow-up test versus that in the pre-test. (b) Median equivalent noise difference (ΔNeq) in the follow-up test versus that in the pre-test. Error bars are the bootstrapped 95% confidence interval for each value. (c) Number of days after post-test that the follow-up test was performed. Note that subject BW did not participate in the follow-up test, and CT, who had the lowest equivalent noise difference in the post-test, did not have a positive median value of equivalent noise difference for the follow-up test (Neq,unflanked > Neq,flanked).

