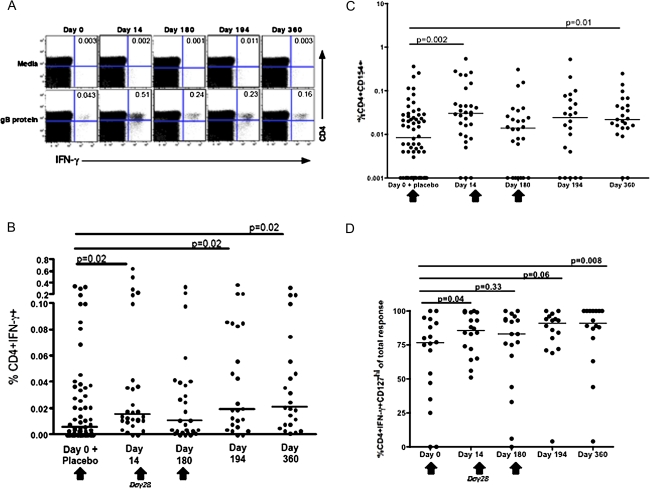
Figure 3.
Induction of glycoprotein B (gB)–specific CD4+ T cells measured by intracellular cytokine staining. A, interferon (IFN) γ secretion from CD4+ T cells from a vaccinated volunteer at day 0 (prevaccination), day 14 (2 weeks after the first vaccination), day 180 (5 months after the second vaccination), day 194 (2 weeks after the third vaccination), and day 360 (6 months after the third vaccination). Peripheral blood mononuclear cells (PBMCs) were stimulated in vitro with gB protein, and the frequency of IFN-γ producing CD3+CD4+ T cells was determined by intracellular cytokine staining assay. Percentage of CD4+ IFN-γ+ cells is indicated in the upper right hand quadrant. B, The generation of gB-specific CD4+ T cells from all vaccinees at the indicated time points is shown. Net responses (ie, with unstimulated responses subtracted) are plotted. C, Upregulation of CD154 on PBMCs from vaccinees in response to gB stimulation after vaccination. D, The proportion of gB-specific CD4+ T cells that are IFN-γ+CD127hi is shown. Only responder individuals, as defined by a positive response to gB by IFN-γ secretion, are shown. Net responses (ie, with unstimulated responses subtracted) are plotted. The median responses are shown by horizontal line. Vaccination time points are indicated by an arrow.

