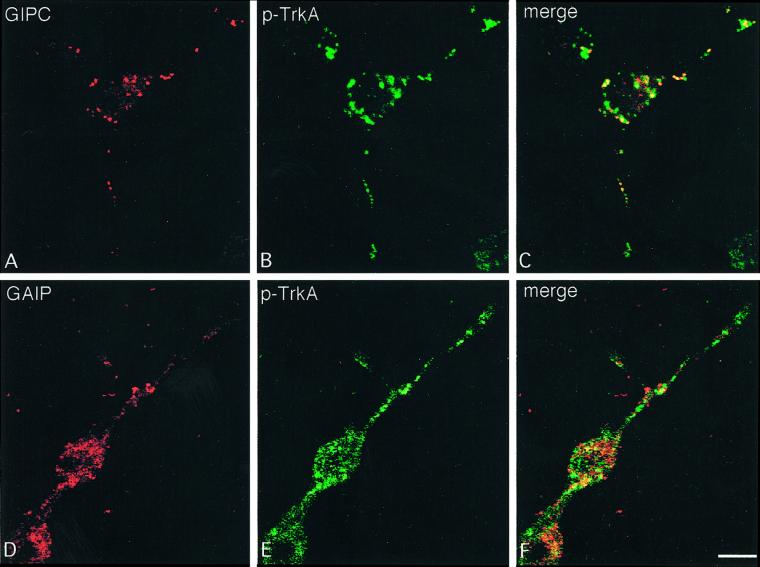
Figure 9.
Codistribution of Tyr496–phosphorylated TrkA (p-TrkA) and endogenous GIPC or endogenous GAIP by immunofluorescence. Endogenous GIPC (A) and p-TrkA (B) are widely distributed within vesicles in the cell bodies, neurites, and neurite termini of PC12 (615) cells. The yellow signals in the merged image (C) demonstrate regions where GIPC and p-TrkA overlap. Endogenous GAIP also shows a vesicular distribution (D), that is finer than that for GIPC. There is less overlap (F) in staining for GAIP (D) and TrkA (E). PC12 (615) cells were treated with 50 ng/ml NGF overnight to allow outgrowth of neurites. Cells were fixed, double labeled with anti-TrkA mAB E-6 (recognizes only p-TrkA) and polyclonal anti-GIPC or anti-GAIP, and examined by confocal microscopy. Bar, 10 μm.

