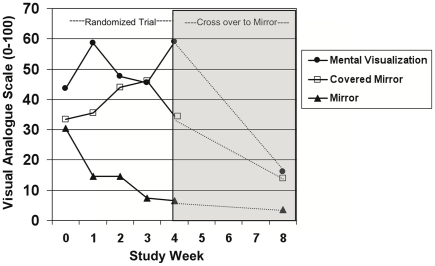
Figure 3.
Change in pain in subjects measured using the VAS. Group medians are depicted for each time point. After the first month (week 4), subjects in the covered mirror and mental visualization groups were switched to using the uncovered mirror. N = 6 per group after accounting for dropouts. Reprinted with permission from the New England Journal of Medicine (Chan et al., 2007).

