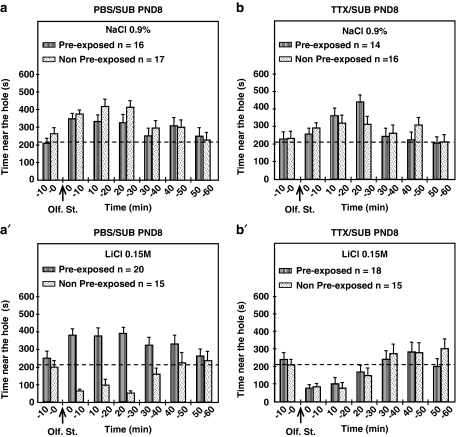
Figure 2.
Time spent near the hole during the test session in pre-exposed (hatched bars) and non-pre-exposed (spotted bars) adult animals microinjected in the left SUB with either PBS (a and a′) or TTX (b and b′) at PND8 of the neonatal period. The arrows indicate when the olfactory stimulus (banana odor) was presented. During the conditioning session, banana odor was associated in control animals with an i.p. injection of NaCl (0.9%) and in conditioned animals with an i.p. injection of the same volume of LiCl (0.15 M). The dashed line represents 35% of one 10-min period (210 s), corresponding to neutral distribution of the rats in the cage. n represents the number of animals per group.

