Figure 7.
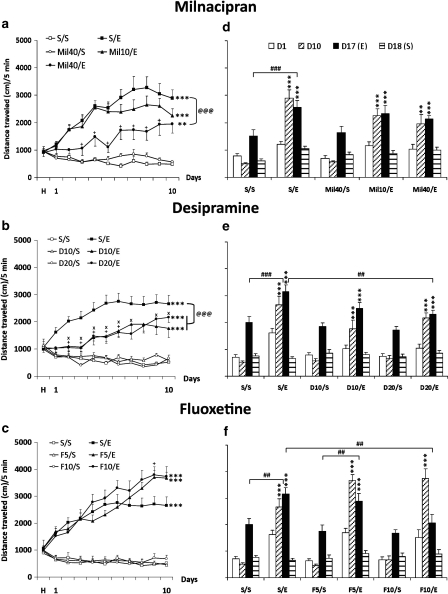
Milnacipran, desipramine, or fluoxetine treatments alter ethanol-induced behavioral sensitization (induction a–c and expression d–f). Means (±SEM) of distance traveled (cm) for a 5-min test are represented. (a–c) Induction phase: On the habituation day (H), each mouse received a saline solution injection. From day 1 to day 10, all mice (n=10 for all groups except for the Mil10/ethanol, n=9, and the Mil40/ethanol, n=8) received an injection of saline solution (S/), milnacipran 10 or 40 mg/kg (Mil10/ or 40/), desipramine 10 or 20 mg/kg (D10/ or D20/), or fluoxetine 5 or 10 mg/kg (F5/ or F10/) before an injection of saline solution (/S) or ethanol 2.0 g/kg (/E). (d–f) Expression phase: on day 17, all groups of mice received an ethanol (2.0 g/kg) injection, and on day 18, they received a saline injection. On day 18, the saline injection did not change locomotor activity as compared with day 1, thus indicating that the maintenance of ethanol sensitization on day 17 was the result of ethanol and not of a conditioned response to the repeated injection paradigm. **P<0.01 and ***P<0.001 indicate significant increase of locomotor activity compared with day 1. +P<0.05 indicates a difference of the Mil40/E (a), the D20/E (b), or the F10/E (c) group compared with its respective S/E group on the same day. xP<0.05 indicates a difference of the D10/E group compared with the S/E group on the same day. @@P<0.01 and @@@P<0.001 indicate a difference between groups throughout the induction phase (from day 1 to day 10). #P<0.05, ##P<0.01, and ###P<0.001 indicate a difference between groups on the same day.

