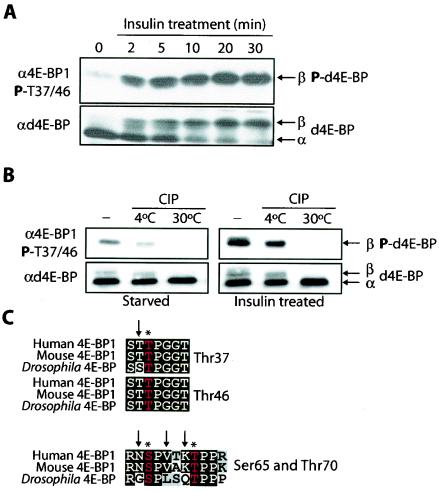
FIG. 1.
Insulin treatment of S2 cells and potential phosphorylation sites of d4E-BP. (A) Time course of d4E-BP phosphorylation in response to insulin. S2 cells were starved for 36 h and stimulated with bovine insulin (1 μg/ml) for the indicated times. (B) Phosphatase treatment. Extracts from starved or insulin-treated S2 cells were treated with CIP for 30 min at the indicated temperatures. The effect of insulin treatment on d4E-BP in panels A and B was assessed by immunoblotting with anti-phospho-4E-BP1(Thr37/46) (α4E-BP1) (top) and by gel shift of the α phosphoisoform to β as visualized by anti-d4E-BP (αd4E-BP) (bottom) using extracts from S2 cells. P, phosphorylated. (C) Sequence alignment of the putative phosphorylation sites of d4E-BP and human and murine 4E-BP1. Identical (solid boxes) and conserved (shaded boxes) amino acids are highlighted. Conserved phosphorylation sites are colored red and marked by asterisks. The arrows indicate differences in (for Thr37, Ser65, and Thr70) or identity of (for Thr46) the amino acids surrounding the putative phosphorylation sites of d4E-BP.

