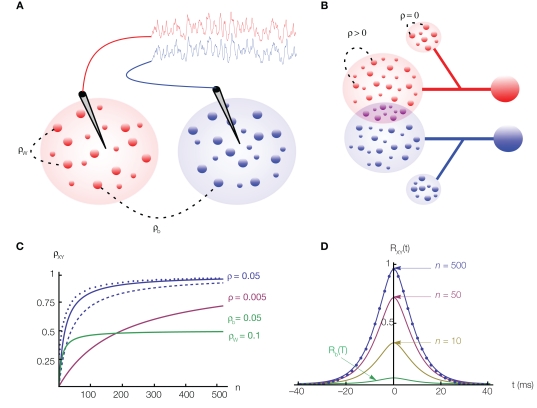
Figure 1.
The effects of correlations on pooled signals. (A) Two electrodes record from non-overlapping populations. Cells from separate (same) populations are correlated with coefficient ρb (ρw). The traces above the populations were obtained by convolving the pooled spike trains with an exponential kernel. Here ρb = ρw = 0.050 and n = 500. Although ρb is small, the traces are strongly correlated. (B) Two cells receiving input from overlapping populations. Each of the two subpopulations on the left contain n cells. All pairs of cells within these subpopulations are correlated with coefficient ρ. The two cells on the right share np of their inputs from these subpopulations (purple intersection). Additionally, each cell receives nq uncorrelated inputs (smaller populations on top and bottom). (C) The dependence of the pooled correlation, ρXY, on population size, n, for the examples in (A,B). Green line corresponds to population model (A) with ρb = 0.05 and ρw = 0.1, while the blue line corresponds to (B) with ρ = 0.05 and p = q = 0 (solid line); p = 0 and q = 1 (dashed line); p = 0.25 and q = 0 (dotted line). A moderate amount of overlap between the populations or independent inputs do not significantly affect the pooled correlation when n is large. The pink line corresponds to model (A) with ρb = ρw = 0.005. (D) The cross-correlation function from the population model in (A) with Rb(t) = Rw(t) = 0.05e−t|/5(1 + |t|/5) and for various values of n. The case n = 500 corresponds to the traces in (A) and the filled circles are from simulations.

