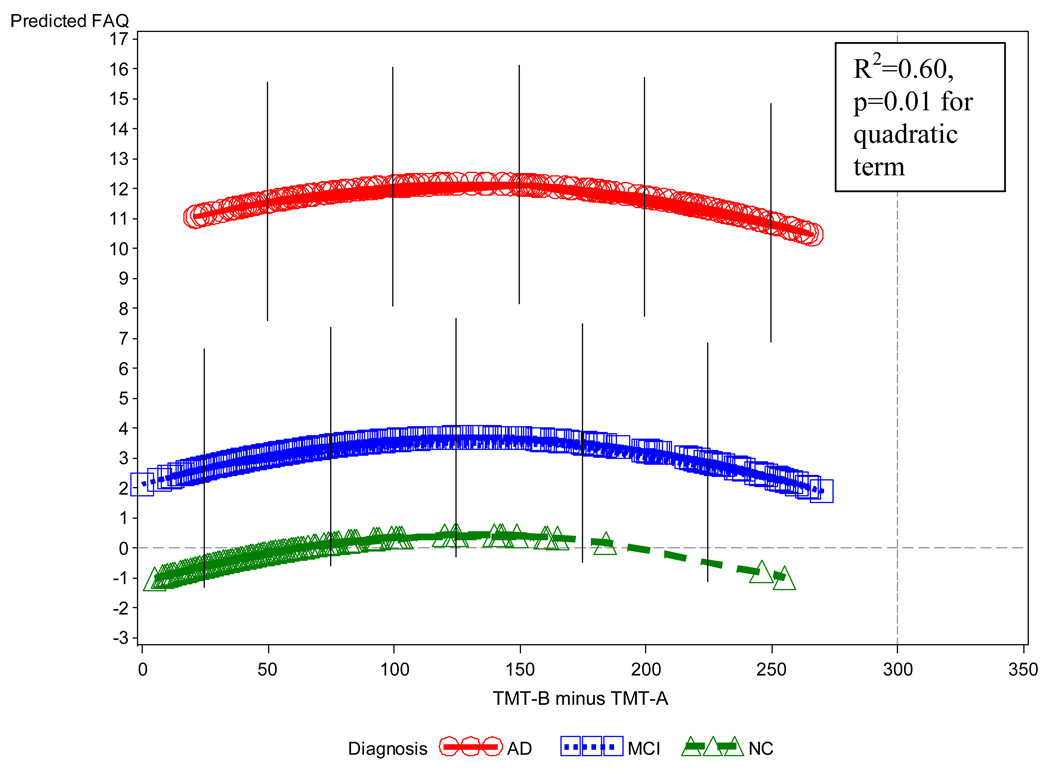
Figure 2.
Predicted values of FAQ vs. diagnostic group and TMT-B-A from the multiple regression model, which also included DSym, age, MMSE, curvilinear terms for RAVLT delayed recall and NPI-Q Apathy item, and an interaction of MMSE with diagnostic group. In this graph, other variables (age, MMSE, RAVLT, NPI-Q Apathy, DSym) are held constant at their grand mean values. The local density of the actual values is indicated by the density of symbols. Error bars indicate the root mean square above and below the predicted value (not shown for NC because of floor effect). Note the relation of TMT-B-A to FAQ within diagnostic groups, additive to the level effects of the diagnostic groups themselves. AD (Alzheimer’s disease), DSym (Digit Symbol), FAQ (Functional Activities Questionnaire), MCI (mild cognitive impairment), MMSE (Mini-Mental State Examination), NC (normal control), NPI-Q Apathy (Neuropsychiatric Inventory Questionnaire brief form, apathy item), RAVLT (Rey Auditory Verbal Learning Test), TMT-B-A (Trailmaking Test B minus Trailmaking Test A).

