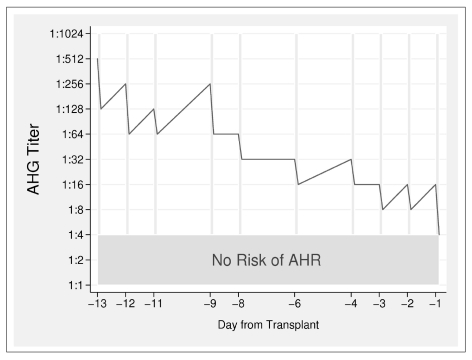
Figure 1.
Trend in the anti-IgG titre (red line) during the desensitisation. The x-axis shows the time in relation to the transplant, the y-axis shows the IgG anti-A1 antibody titre. The vertical grey lines represent the sessions of immunoadsorption. The green band at the bottom shows the titre at which the transplant could be performed because the risk of antibody-mediated rejection is virtually nonexistent.

