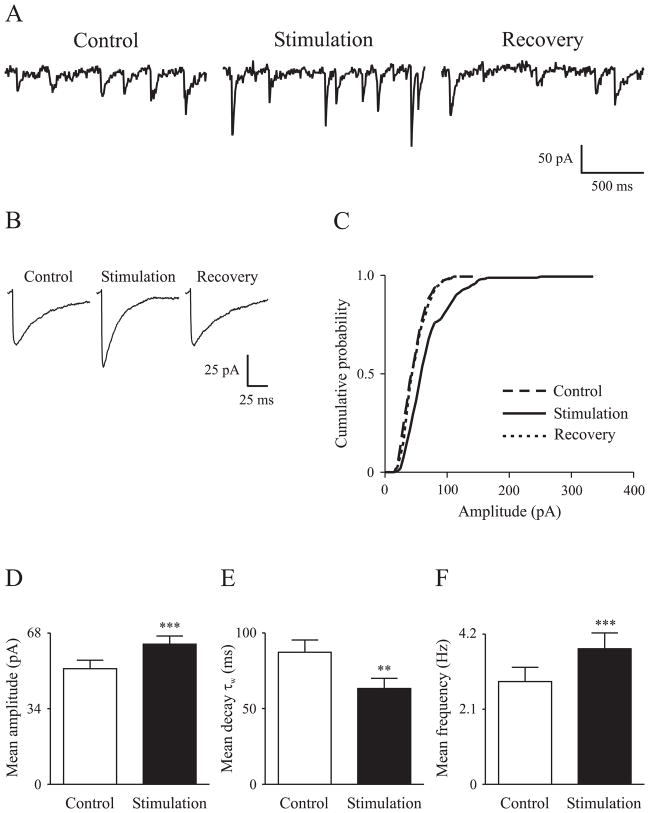
Figure 1. Alteration of sIPSC properties by optical stimulation.
A, Raw sIPSC traces prior to (control), in the presence of (stimulation) and 10 minutes after (recovery) optical stimulation. B, Average sIPSCs to show the amplitude and decay changes due to optical stimulation. C, Cumulative probability plot to show the enhancement (rightward shift) of sIPSC amplitude by optical stimulation. D, E, F, Bar graphs to show the significant changes in mean sIPSC amplitude, weighted decay time constant (decay τw) and frequency prior to and in the presence of optical stimulation, respectively. Error bars denote SEM. Laser light parameters: radiant exposure, 0.36 J/cm2; repetition rate, 30 Hz; pulse width, 2 ms.
** Significantly different from control at p<0.01; *** p<0.001

