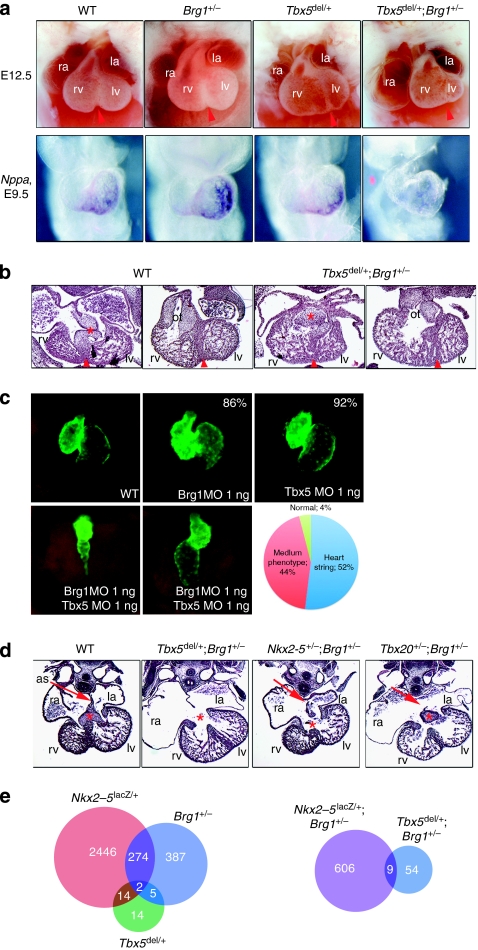
Figure 5. Genetic interactions between Brg1 and cardiac transcription factor genes.
(a) Brg1 and Tbx5 genetically interact. The top row shows an external view of hearts from E12.5 WT, Brg1+/−, Tbx5del/+ and Brg1+/−;Tbx5del/+ embryos; the bottom row shows expression of Nppa at E9.5 for the same genotypes. Original magnification: ×50. (b) Histology of E11.5 WT and Brg1+/−;Tbx5del/+ embryos. Brg1+/− or Tbx5del/+ embryos are indistinguishable from WT. Asterisk indicates atrioventricular cushion and arrowhead indicates interventricular septum. Original magnification: ×100. (c) Brg1 and Tbx5 interactions in zebrafish. Tg(cmlc2:eGFPtwu34) control (WT) or MO-injected embryos are shown in ventral–anterior views at 72 hpf. Brg1MO: MO directed against Brg1; Tbx5MO: MO directed against Tbx5. All MOs were injected at 1 ng. Percentages in the Brg1MO and Tbx5MO show the percentage of normal hearts. The graph shows the percentage of phenotypes observed in double knockdown experiments (n=74, 91 and 126 for brg1, tbx5 and brg1+tbx5 morpholino injections, respectively). Original magnification: ×400. (d) Brg1 genetically interacts with Tbx5, Nkx2–5 and Tbx20. Histology of E12.5 hearts shows specific defects in Brg1+/−;Tbx5del/+, Brg1+/−;Nkx2–5+/− and Brg1+/−;Tbx20+/− embryos, compared with WT. Nkx2–5+/− and Tbx20+/− hearts are structurally identical to WT hearts. Asterisk indicates atrioventricular cushion and arrow indicates atrial septum (as). Original magnification: ×100. (e) Summary of microarray analysis performed on E11.5 hearts of the indicated genotypes. Venn diagrams show the number of altered transcripts for each genotype, using a statistical cutoff of P<0.01 and fold change >0.3. la, left atrium; lv, left ventricle; ot, outflow tract; ra, right atrium; rv, right ventricle.

