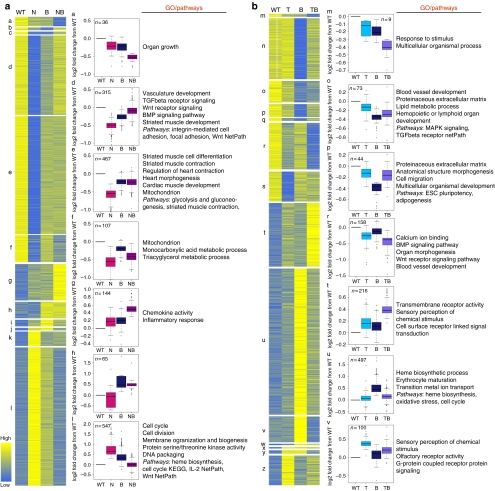
Figure 6. Clustering analysis of altered gene expression.
(a) Clustering analysis of altered transcripts from Nkx2–5+/− (N), Brg1+/− (B) and compound heterozygotes, Nkx2–5+/−;Brg1+/− (NB) E11.5 hearts. Heart maps for all statistically significant clusters indicate the average value for each group. All biological replicates within groups were included in cluster analyses; figures were made by taking the mean for each group. Box plots for a selection of clusters show the median (middle line), third and first quartile (top and bottom (hinges) of the boxes); the 'whiskers' extend 1.5× the length of the box, with other points (outliers) plotted as circles. Statistically significantly overrepresented Gene Ontology (GO) categories (adjusted P<0.01) are shown. Genotypes are shown on the x axis; y axis shows log 2 fold change from WT. (b) Clustering analysis as in B, but for transcripts from Tbx5del/+ (T), Brg1+/− (B) and compound heterozygotes, Tbx5del/+;Brg1+/− (TB) E11.5 hearts.

