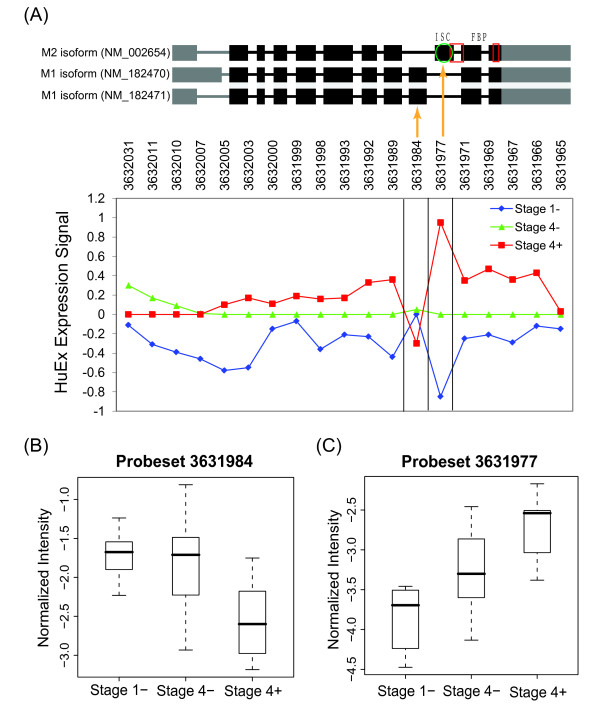
Figure 3.
Alternative splicing of pyruvate kinase (PKM2) detected by Affymetrix exon (HuEx) array. (A) Gene structure of known isoforms is shown on the top panel with predicted domains/motifs that differ in protein isoforms. Green oval shows intersubunit contact (ISC) sequence, and red boxes point to fructose 1,6-bisphosphate (FBP) binding regions as defined by UniProt. The HuEx expression is shown on the bottom panel. Each point represents mean log2-expression of each group that was then median-centered across three groups. Orange lines point to probeset 3631984 that mapped to the unique exon in isoform M1 (NM_182470 and NM_182471), and probeset 3631977 that mapped to the unique exon in isoform M2 (NM_002654). While isoform M2-specific probeset showed increased expression in stage 4+ compared to stage 4-/1- tumors, isoform M1-specific probeset indicated lower expression in stage 4+ tumor. (B) Normalized intensity (NI) values for probeset 3631984 in Stage 1-, 4- and 4+ tumors. (C) Normalized intensity values for probeset 3631977 in Stage 1-, 4- and 4+ tumors. The expression for probesets 3631984 and 3631977was significantly different between stage 1- and 4+, suggesting the increased expression of isoform M2 and reduced expression of isoform M1 in MYCN-amplified neuroblastoma.

