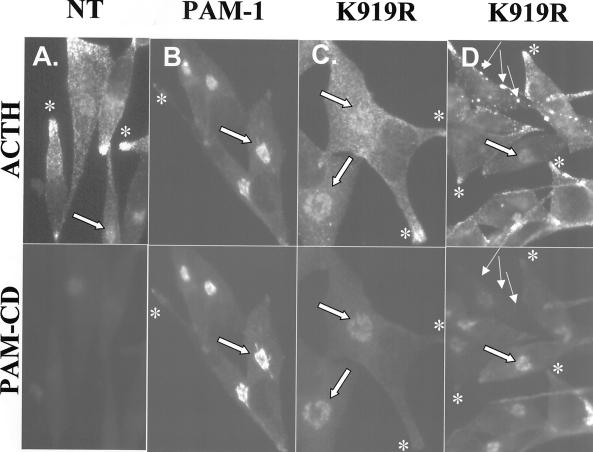
Figure 6.
ACTH localization in PAM-1/K919R Cells. Nontransfected (A), PAM-1 (B), and PAM-1/K919R (C and D) AtT-20 cells were visualized simultaneously with rabbit polyclonal ACTH antiserum (top; JH93) and mouse monoclonal antibody to the CD of PAM (bottom). Asterisks indicate the tips of processes; thin arrows indicate large vesicular structures; thick arrows indicate the TGN region.

