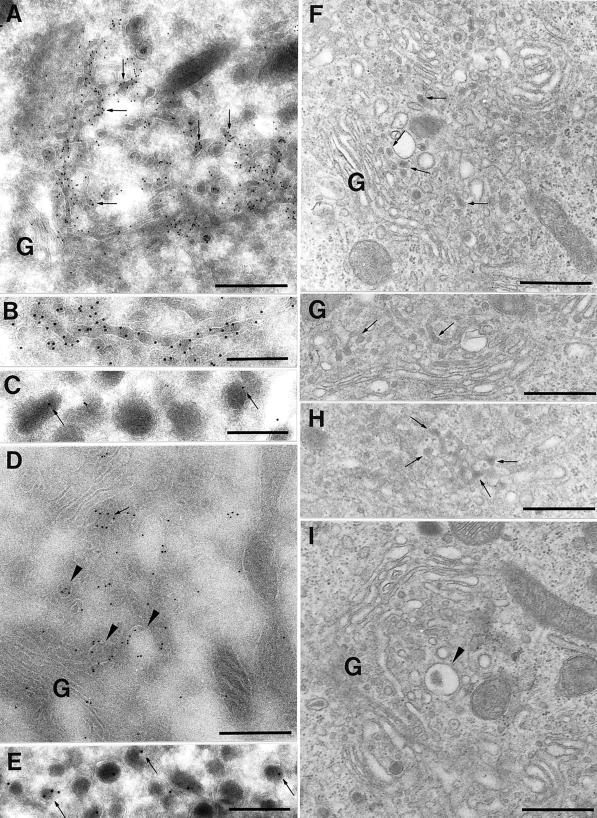
Figure 7.
Ultrastructural analysis of AtT-20 cells expressing PAM. (A–E) Immunoelectron microscopy. PAM staining in tubular or vesicular structures (arrows) and rounded structures (arrowheads) at the trans side of Golgi cisterns (G) in PAM-1 (A and B) and PAM-1/K919R (D) cells. PAM staining in mature secretory granules (arrows) in PAM-1 cells (C) and PAM-1/K919R cells (E). Scale bar, 0.5 μm (A, D) or 0.25 μm (B, C, E). (F–I) Electron microscopy. Golgi area of PAM-1 cells (F–H) and a PAM-1/K919R cell (I) showing electron-dense condensations in the TGN (arrows) only in PAM-1 cells. A typical immature secretory granule is shown at the arrowhead in I. Scale bar, 0.5 μm.

