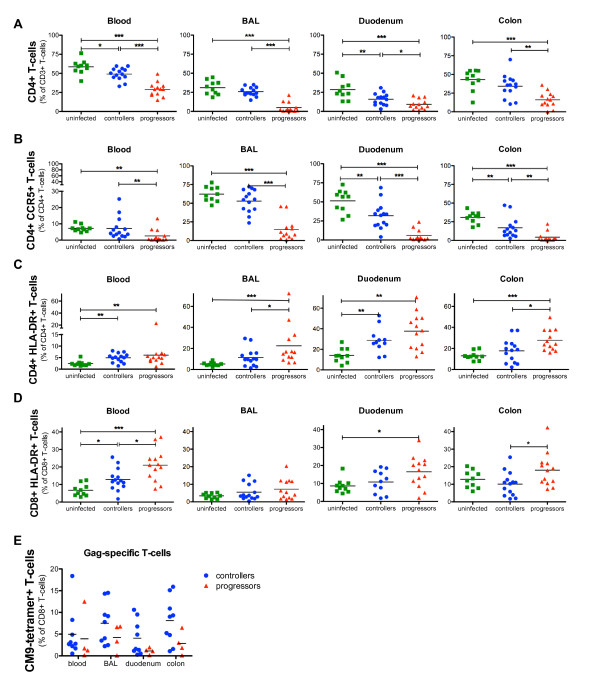
Figure 2.
T-cell analyses in blood, BAL, duodenum and colon of controllers, progressors and uninfected RM. Flow cytometric analyses of (A) CD4+ T-cells, (B) CD4+CCR5+ T-cells, (C) CD4+HLA-DR+ T-cells, (D) CD8+ HLA-DR+ T-cells in blood, BAL, duodenum and colon of controllers, progressors and uninfected animals. (E) SIV-Gag specific T-cells were detected with CM9-tetramers in blood, BAL, duodenum and colon of Mamu-A1*001 controllers (blue) and progressors (red). Horizontal lines represent the mean of each group and P-values were calculated with the Mann-Whitney's U-test (*P < 0.05, **P < 0.01 and ***P < 0.001).

