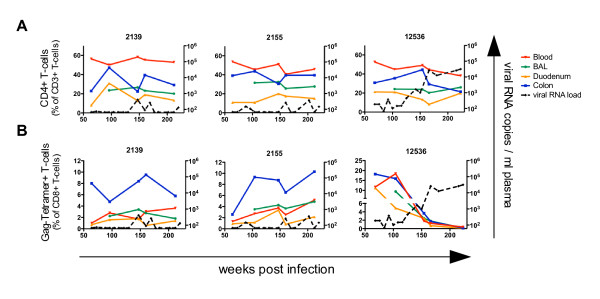
Figure 3.
Long-term analyses of blood and mucosal CD4+ and Gag-specific T-cells in SIV infected RM. Long-term flow cytometric analyses of (A) CD4+ T-cells and (B) CD8+ CM9-tetramer+ T-cells in blood (red), BAL (green), duodenum (yellow) and colon (blue) of three SIV-infected animals together with plasma viral RNA load (dashed line). Two representative controllers (2139+2155) effectively controlling viral replication (A+B left and middle panels) are shown. One RM (12536) defined as controller until week 150 p.i., was then excluded from the controller group due to its gradually increasing plasma viral load but further investigated until week 220 p.i. (A+B right panels).

