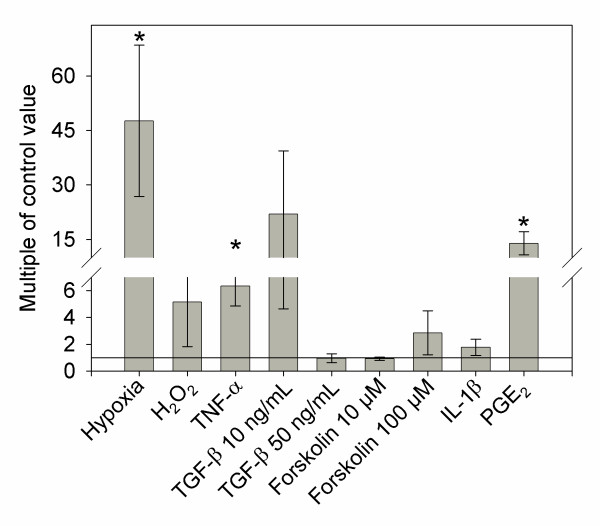
Figure 1.
PAPPA2 mRNA expression in BeWo cells. PAPPA2 mRNA levels are expressed as fold change compared to control (0.1% ethanol was used as a control for forskolin). Cells were treated for 24 hours with 10 μM forskolin, 100 μM forskolin, 20 μM H2O2, 2% O2 (hypoxia), 100 ng/mL IL-1β, 1 μM PGE2, 10 ng/mL TGF-β, 50 ng/mL TGF-β, and 100 ng/mL TNF-α, N = 5. Columns with an asterisk (*) indicate expression significantly different from the control (p < 0.05). Although the mean 10 ng/mL TGF-β expression is high, only one of the five replicates showed high expression levels relative to controls.

