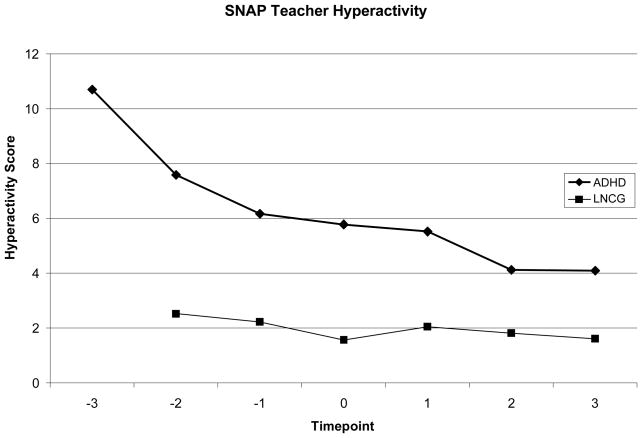
Figure 5.
Teacher rated symptoms of hyperactivity on the SNAP Rating Scale. In order to equate the transition year across participants, the x-axis represents grade with the transition year coded as time 0 and consecutive negative integers for the preceding elementary school years (e.g., −2, −1) and positive integers for the post-ceding middle school years (e.g., 1, 2). The LNCG does not have a timepoint −3 because participants were not recruited until the 24 month MTA timepoint.

