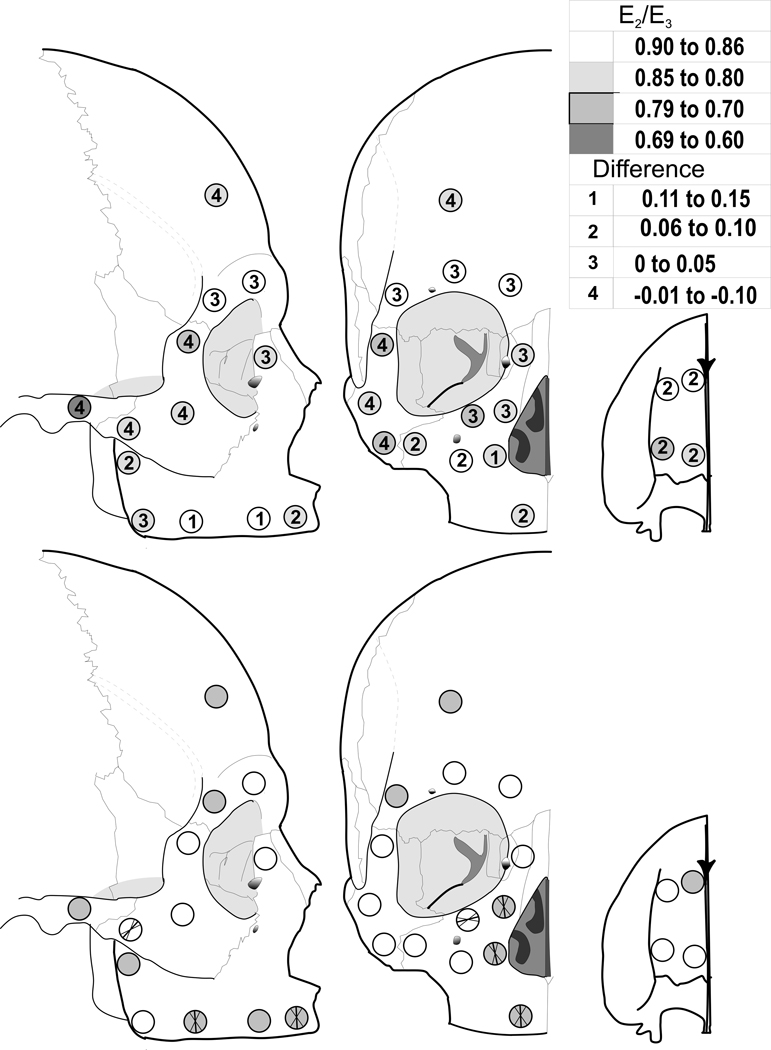
Figure 6.
Top: Average cortical bone anisotropy (E2 /E3) in the edentulous crania (shading) and difference compared with dentate crania (numbers). Bottom: Six sites show significant mean orientations of maximum stiffness (E3) among the edentulous crania. These sites are indicated by the bold intersecting lines that illustrate the mean orientations and the non-bolded lines that are the 95% confidence intervals. The shaded sites are those with significant average orientations in the dentate comparison sample (see Table 6).

